


Day Trading Complete Guide: Strategies, Indicators, and Tips for Beginners
You have probably heard that day trading can set you financially free, or that it will drain your account inside a week. Reality typically lands somewhere between those extremes, and where you end up depends almost entirely on how well you understand what you are doing before real money is on the line.
This guide is day trading explained from the ground up. What you will find here is a practical walkthrough of how day trading actually works, which strategies and indicators real traders rely on, how to surface stocks worth trading, and how to manage risk so a single bad trade does not undo weeks of progress.
This article is for educational purposes only and does not constitute financial advice. Day trading involves substantial risk of loss and is not suitable for every investor.

What Is Day Trading and How Does It Work?
Day trading has a clear appeal. You start and finish each day flat, with no positions held overnight, no surprise gap-downs while you sleep, and complete control over when you are exposed to the market. Beneath that surface sits a genuinely skill-intensive process, one where every decision has to be made under time pressure with real capital at stake.
Core Mechanics of a Day Trade
At its core, a day trade is any position opened and closed within the same trading session. You buy (or short sell) a stock, ETF, or other instrument, and you exit before the market closes that day.
What gives day trading its character compared to simply "buying stock" is the speed and intention behind every decision. Day traders exploit short-term price movements driven by supply and demand imbalances, news catalysts, technical patterns, or momentum shifts.
Here is what a typical day trade involves:
- Scanning for setups before or during market hours using a stock screener
- Identifying an entry point based on a chart pattern, indicator signal, or price level
- Executing the trade with a predetermined stop loss and profit target
- Managing the position actively, adjusting or exiting based on how price behaves
- Closing the trade before the session ends, win or lose
The entire cycle might take five minutes or five hours, but it always resolves within the same trading day. Your profit or loss comes from capturing small price moves, often fractions of a percentage, amplified by position size.
Day Trading vs. Swing Trading vs. Position Trading
Understanding where day trading sits on the spectrum helps you decide if it matches your schedule and temperament.
Each approach has its own trade-offs, which are easier to see side by side:
- Day trading: demands the most screen time, and in exchange eliminates overnight exposure entirely.
- Swing trading: offers more flexibility around your schedule, provided you are comfortable holding positions through after-hours moves.
- Position trading: the most hands-off of the three, though it ties up your capital for longer stretches.
A more useful question is which approach actually fits your life right now, because the one you can execute consistently is the one that will produce results.
Who Can Day Trade? (Capital Requirements, PDT Rule, Global Considerations)
Before you commit to day trading, you need to know the rules of the game, especially if you are based in the United States.
The Pattern Day Trader (PDT) rule applies to US-based traders using margin accounts. If you execute four or more day trades within five business days, and those trades represent more than 6% of your total trading activity in that period, your broker will flag you as a pattern day trader. Once flagged, you must maintain a minimum equity of $25,000 in your account to continue day trading.
Note: As of January 2026, FINRA has filed a proposed rule change with the SEC that would eliminate the $25,000 minimum equity requirement and the pattern day trader designation entirely. The proposal has not been finalized, and the existing rules remain in effect until further notice. Always verify the current regulatory framework before funding a live account.
That $25,000 threshold stops many beginners before they even get started. But there are workarounds worth knowing:
- Cash accounts are not subject to the PDT rule. However, it is worth noting that FINRA’s stated position is that day trading in a cash account is generally not permitted. In practice, you can execute same-day trades using fully settled funds, though you are limited by settlement timing (trades take one business day to settle for stocks under current SEC rules), which restricts how frequently you can trade.
- Prop trading firms allow you to trade with the firm’s capital, often bypassing the PDT requirement entirely (you can learn more about how prop trading works in our guide to prop trading)
- Non-US brokers may operate under different regulations, so the PDT rule is not universal
If you are trading from outside the US, your local regulations will differ. Some countries have no equivalent of the PDT rule, while others impose their own restrictions on leverage, margin, or trade frequency. Always check your jurisdiction’s specific requirements before funding a live account.
With the mechanics and eligibility rules covered, one of the first practical decisions you will face is which chart timeframe to trade on.
Compare spreads and regulation across the best CFD brokers.
Best Timeframes for Day Trading
Choosing the wrong timeframe is like trying to read a road map at the wrong zoom level. If you are too close, you catch every bump but miss the highway, and if you zoom out too far, you cannot navigate the turns. Your timeframe shapes the signals you see and the pace of every decision you make.
Why Timeframe Selection Shapes Your Trading
Every candlestick on your chart represents a specific window of time. On a 1-minute chart, a new candle prints every 60 seconds, delivering rapid information flow and forcing fast decisions, while a 15-minute chart gives you fewer signals but more reliable ones because each candle absorbs more data.
Your timeframe choice directly affects:
- Trade frequency: shorter timeframes produce more signals (and more noise)
- Required screen time: faster charts demand near-constant attention
- Stop loss size: tighter timeframes often mean tighter stops, which means you will get stopped out more frequently
- Emotional pressure: watching every tick on a 1-minute chart is psychologically draining
The right time frame depends on your strategy, your temperament, and how much time you can realistically dedicate to active trading.
Popular Day Trading Timeframes (1-Min, 5-Min, 15-Min, 1-Hour)
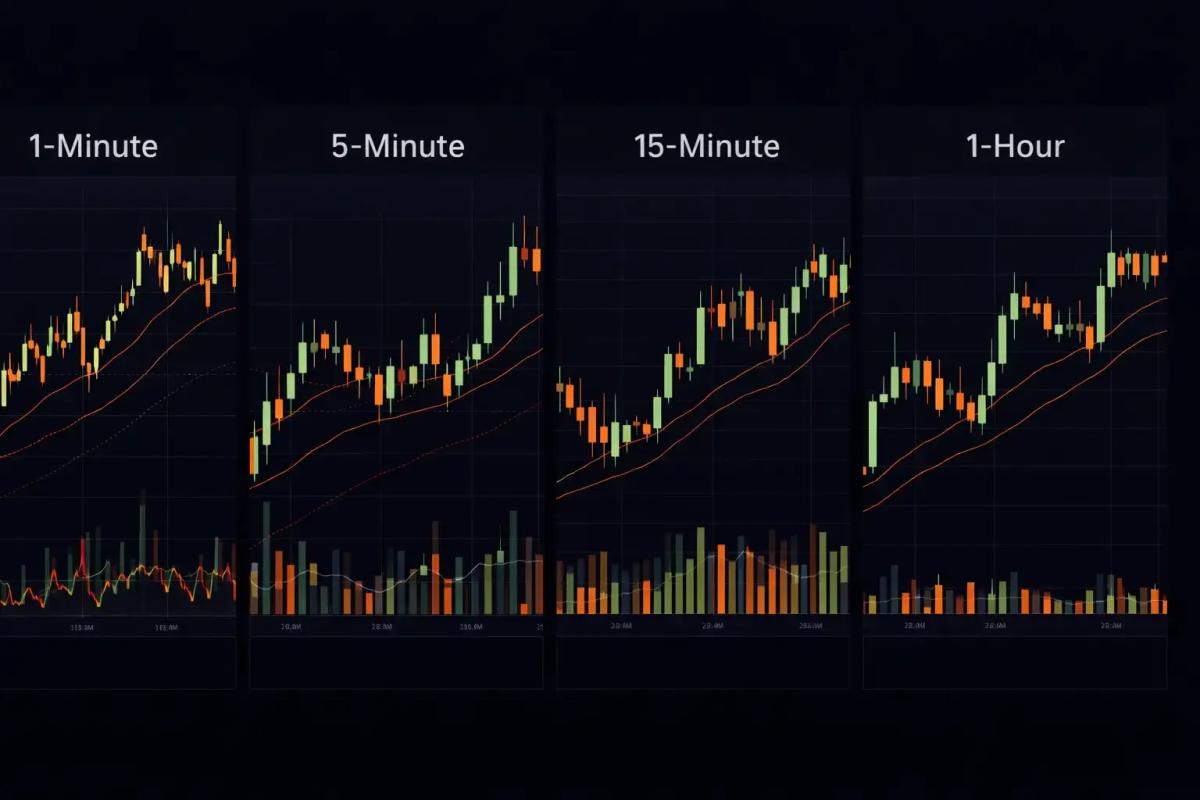
Here is how each common timeframe holds up in practice:
- 1-Minute Chart: The fastest standard timeframe. Used primarily by scalpers who hold trades for seconds to a few minutes. It generates a high volume of signals, but many turn out to be noise. Requires intense focus and razor-sharp execution.
- 5-Minute Chart: The most popular day trading timeframe, and for good reason. It strikes a balance between signal frequency and reliability. Most intraday strategies perform well here, and it serves as the default chart for many active traders.
- 15-Minute Chart: Produces cleaner signals with less noise. A strong fit for traders who prefer fewer, higher-quality setups. Works particularly well for breakout and momentum strategies where you want confirmation before committing capital.
- 1-Hour Chart: Sits at the boundary between day trading and swing trading. Useful for reading the broader intraday trend or for traders who cannot monitor the screen all day. Expect fewer trades per session.
How to Match Timeframes to Your Strategy
Think of timeframe selection as a compatibility question. If you are scalping, a 15-minute chart moves too slowly to give you the entries you need. If you are trading breakouts, a 1-minute chart will trigger too many false breaks driven purely by noise.
A widely used approach is the multi-timeframe method: use a higher timeframe (like the 15-minute) to identify the overall trend direction, then drop to a lower timeframe (like the 5-minute or 1-minute) to time your entry. This way, you trade in the direction of the larger move while pinpointing entries on the smaller chart.
The indicators you use will also shape which timeframe works best. So let’s turn to the tools that help you read those charts.
Best Indicators for Day Trading
Indicators are tools that organize raw price data into visual signals, helping you make faster and more consistent decisions. The key is knowing which ones to use, how to configure them for intraday trading, and which signals actually carry weight. If you want a deeper foundation, our guide to technical analysis indicators covers the broader landscape.
Best EMA Settings for Day Trading
The Exponential Moving Average (EMA) is one of the most widely used tools in a day trader's toolkit. Where a Simple Moving Average treats every data point equally, the EMA weights recent price data more heavily, which makes it more responsive to current conditions. It functions as a trend filter that reacts quickly without overreacting to every tick.
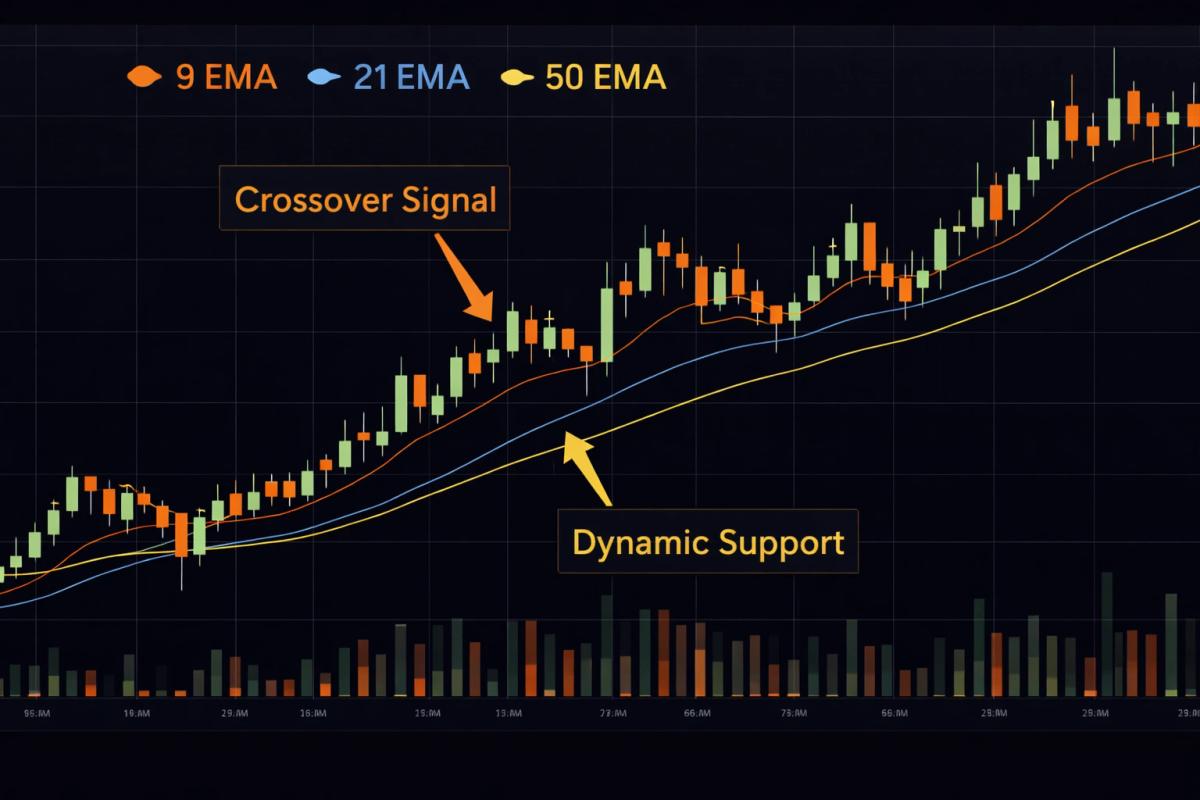
The three EMA settings most day traders rely on are:
- 9 EMA: Your fast-moving line. It hugs price action tightly and is useful for spotting short-term momentum shifts. When price pulls back to the 9 EMA and bounces, that often signals trend continuation.
- 21 EMA: The intermediate line. It filters out more noise than the 9 and acts as dynamic support or resistance on 5-minute and 15-minute charts. Many traders treat the 9/21 EMA crossover as a trade signal.
- 50 EMA: The slow line, representing the broader intraday trend. When price sits above the 50 EMA, the general bias leans bullish, and when it drops below, the bias flips bearish. Day traders often avoid taking long trades when price sits below the 50 EMA, and vice versa.
The real power emerges when you layer all three together. When the EMAs are stacked in order (9 above 21 above 50 for an uptrend), you have strong trend confirmation. When they begin to converge or cross, it signals that momentum may be shifting.
A common beginner mistake is acting on every EMA crossover in isolation. Crossovers are far more meaningful when confirmed by volume and supported by the broader price structure. That brings us to another indicator that pairs exceptionally well with EMAs.
How to Use MACD for Day Trading
MACD (Moving Average Convergence Divergence) measures the relationship between two EMAs, typically the 12-period and 26-period, and plots the difference as a line alongside a signal line (usually a 9-period EMA of the MACD itself). Below the chart, you will see a histogram that visualizes the gap between these two lines.
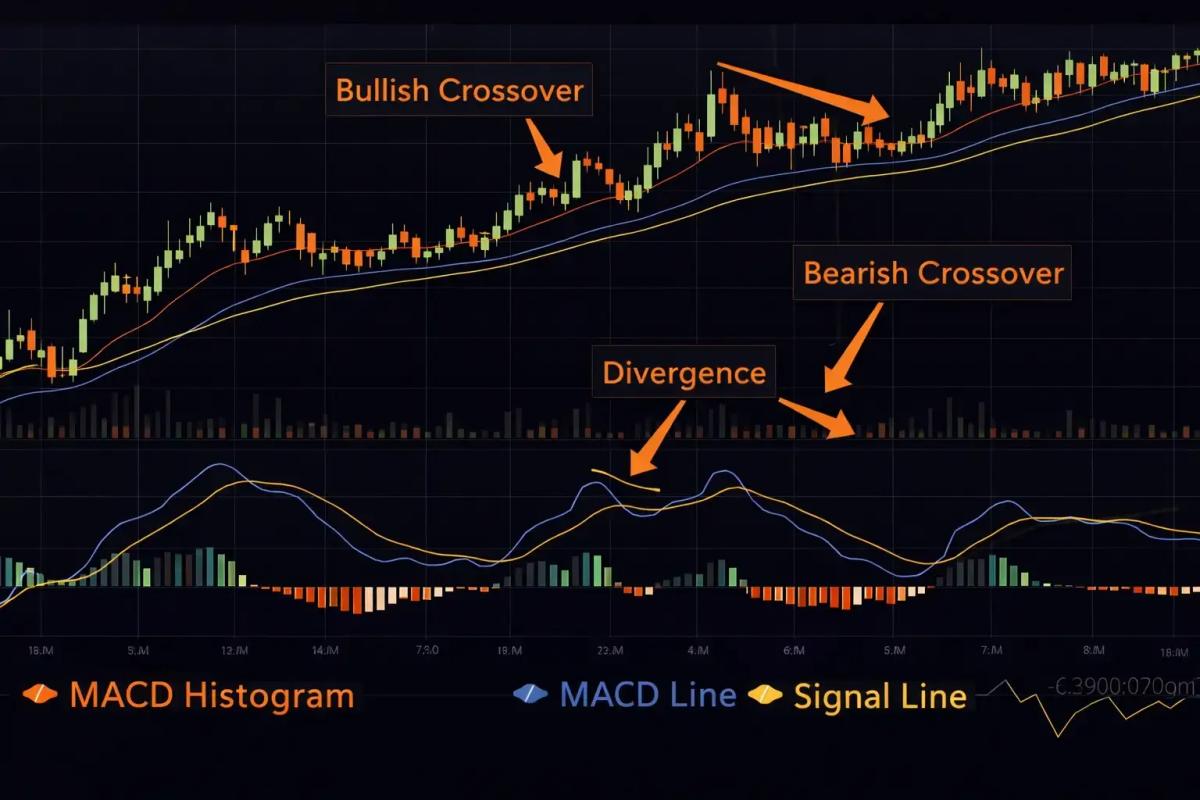
Here is what to watch for on intraday charts:
- Bullish crossover: The MACD line crosses above the signal line, suggesting upward momentum is building. This signal carries the most weight when it occurs below the zero line, where the stock is shifting from bearish into bullish territory.
- Bearish crossover: The MACD line crosses below the signal line, suggesting momentum is fading or reversing. Most significant when it happens above the zero line.
- Divergence: When price prints a new high but MACD makes a lower high (or price makes a new low while MACD makes a higher low), the current move is losing steam. Divergence is a clear warning to tighten your risk.
For day trading, the default MACD settings (12, 26, 9) work well on 5-minute and 15-minute charts. Some scalpers adjust to faster settings (like 5, 13, 1) for quicker signals, but faster settings also generate more false positives.
The biggest trap with MACD is using it during choppy, range-bound markets, where the indicator will whipsaw you in and out of trades for no gain. MACD performs best when there is a clear trend, so pairing it with a trend filter like the 50 EMA helps you sidestep the sideways periods where it tends to fail.
Other High-Value Day Trading Indicators (VWAP, RSI, Volume)
Beyond EMAs and MACD, three other indicators earn a place on your charts:
VWAP (Volume Weighted Average Price) is the benchmark institutional traders watch. It shows the average price weighted by volume throughout the day. When price sits above VWAP, buyers are in control, and when it drops below, sellers dominate. Many day traders use VWAP as a decision line, going long above it and short below it, or watching for reversals at VWAP touches.
RSI (Relative Strength Index) measures how overbought or oversold a stock is on a scale of 0 to 100. On intraday charts, readings above 70 suggest the stock may be overextended to the upside, while readings below 30 suggest it may be oversold. RSI is most valuable for timing entries within an existing trend or spotting potential turning points.
Volume sits outside the traditional indicator category and remains arguably the most important data point on your chart. It confirms the conviction behind a price move, since a breakout on high volume carries far more weight than one on thin volume. Sudden volume spikes can also signal institutional activity, news-driven moves, or the beginning of a significant trend.
No single indicator gives you the full picture. The best day traders combine two or three complementary tools and learn to read them in context alongside price action and volume, so signals reinforce each other instead of being taken at face value.
Now that you have the analytical tools, how do you actually structure a trade? That is where strategies come in.
Day Trading Strategies That Work
Every profitable day trader operates from a defined strategy, a repeatable set of conditions that must be true before they enter a trade. Without one, you end up reacting to charts on emotion, which rarely ends well over a full trading week. Here are four proven approaches, each built on a different logic and suited to a different trading personality.
Remember: no strategy works 100% of the time. The goal is finding one with a positive edge when executed consistently alongside proper risk management.

Momentum Trading
Momentum trading is about riding a stock that is already moving strongly in one direction.
The logic is intuitive: stocks that are moving tend to keep moving, at least in the short term. Catalysts like earnings surprises, news releases, or sector momentum create bursts of directional energy that momentum traders look to capture.
What you look for:
- Stocks gapping up or down significantly at the open
- High relative volume (at least 2-3x the average)
- Price trading above VWAP and key EMAs (for long trades)
- Continuation patterns on your chosen timeframe
Momentum trading tends to work best during the first one to two hours after market open, when volume and volatility peak.
Breakout Trading
Breakout traders wait for price to push beyond a defined level of support or resistance, then enter in the direction of the break. The idea is that once price clears a level it has been respecting, the resulting move can accelerate quickly as stop orders trigger and new participants pile in.
Key elements of a breakout setup:
- A clear consolidation range or pattern (triangle, flag, flat base)
- Decreasing volume during consolidation, followed by a volume surge on the breakout
- The break should be decisive, closing cleanly beyond the level with conviction behind it
The primary risk with breakout trading is the false breakout, where price briefly pierces a level then snaps back. To reduce this, many traders wait for a candle to close beyond the level before entering, or they require volume confirmation before committing.
Scalping
Scalping is the fastest form of day trading, with positions opened and closed within seconds to minutes, targeting tiny price increments repeated dozens of times throughout the session. You are collecting small profits on each trade, often enough that the gains compound.
Scalping demands:
- Very tight spreads (you need liquid, high-volume stocks)
- Fast execution (a direct-access broker is ideal)
- The 1-minute or even tick chart as your primary timeframe
- Extreme discipline, because one oversized loss can erase a full day of small wins
Scalping does not suit every temperament, since it requires intense concentration and quick reflexes, and transaction costs can eat into razor-thin margins. For traders who thrive on speed and precision, however, it can be highly effective when executed with discipline.
Reversal (Mean Reversion) Trading
Reversal trading, sometimes called mean reversion, is the contrarian play in which you look for stocks that have moved too far, too fast, and bet on a snap-back toward an average price.
What signals a potential reversal:
- RSI reaching extreme levels (above 80 or below 20 on intraday charts)
- Price extended well beyond VWAP or key moving averages
- Candlestick reversal patterns (hammer, doji, engulfing) at key levels
- Divergence between price and MACD
Reversal trading can be profitable, but it is inherently riskier than trend-following approaches because you are trading against the prevailing momentum. Position sizing should be conservative, and stop losses need to be tight. Understanding trading psychology is critical here, since it takes real discipline to trade against the crowd.
With strategies and indicators in hand, the next question is natural: which stocks do you actually trade?
Best Day Trading Stocks and How to Find Them
You could have the best strategy in the world, but if you apply it to a stock that barely moves or has paper-thin volume, your results will disappoint. Choosing the right stocks is every bit as important as choosing the right setup.
What Makes a Stock Good for Day Trading
The ideal day trading stock has a few non-negotiable characteristics:
- High liquidity: You need to enter and exit quickly without moving the price against yourself. Stocks with high average daily volume (typically over 1 million shares) provide the liquidity you need.
- Volatility: Price needs to actually move for you to profit. Look for stocks with an Average True Range (ATR) that offers enough intraday range relative to your stop loss size.
- Tight bid-ask spread: A wide spread is a hidden cost on every trade. The most liquid stocks tend to have penny-wide spreads.
- Catalyst or momentum: Stocks making news, reporting earnings, or riding sector-driven moves tend to produce the cleanest intraday trends.
Day Trading Penny Stocks: Opportunities and Risks
Penny stocks (generally priced under $5) attract day traders because of their potential for large percentage moves. Imagine a stock jumping from $1.50 to $2.00: that is a 33% gain, which looks incredible on paper.
Weighing that appeal against reality, penny stocks carry serious risks that often outweigh the potential upside:
- Low liquidity: Many penny stocks have thin order books, meaning slippage can quietly eat your profits
- Wide spreads: The bid-ask spread on a $1 stock can represent 5-10% of the price itself
- Manipulation risk: Penny stocks are more susceptible to pump-and-dump schemes and deceptive promotion
- Limited information: Many penny stock companies publish minimal financial data, making due diligence difficult
- Halts and delistings: Extreme volatility can trigger trading halts, and some penny stocks get delisted entirely
Some traders do turn a consistent profit on penny stocks, though the odds are stacked against beginners, and the risk of significant loss runs higher than with more established names. If you choose to trade them, use smaller position sizes and tighter risk controls than you normally would.
How to Use a Stock Screener for Day Trading
A stock screener is your filter system. You set criteria and let the screener surface the best candidates from hundreds of tickers, sparing you the manual scan.
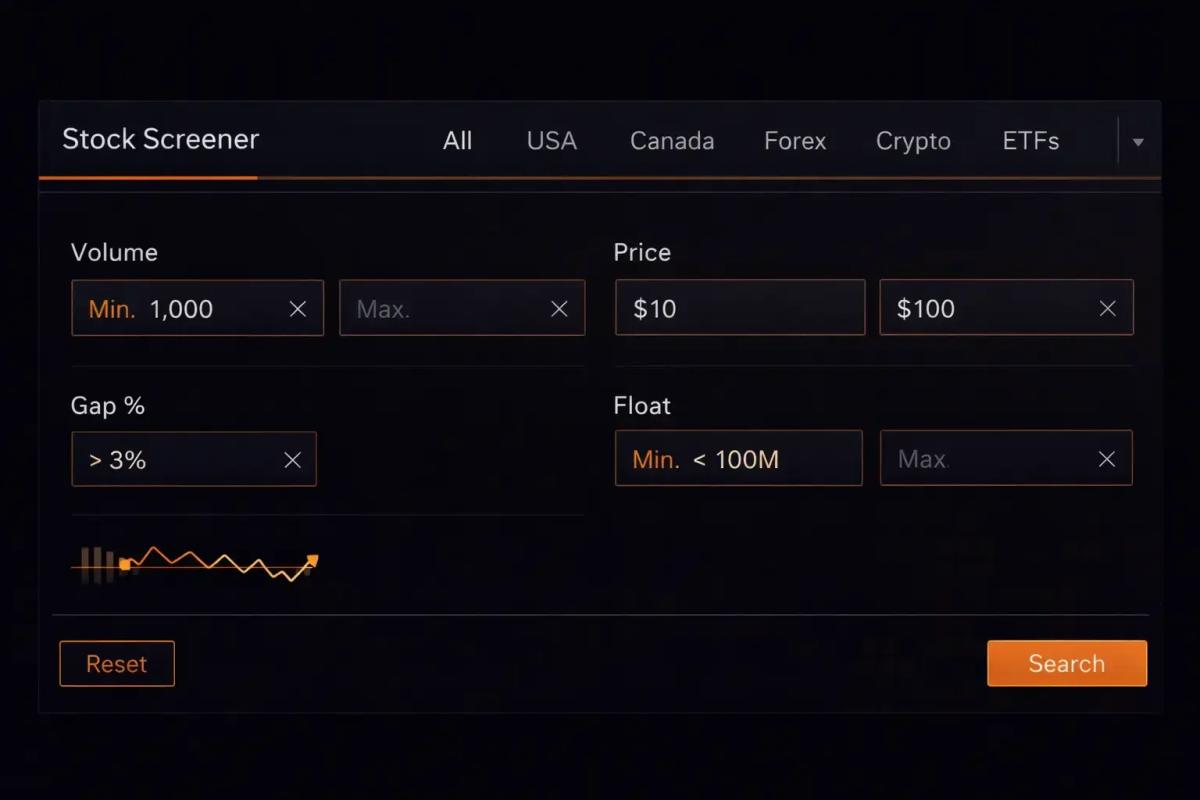
Here are the key screener filters most day traders use:
Most traders run their screener before the market opens and again during the first 30 minutes of trading. The pre-market scan builds your watchlist, and the intraday scan catches emerging opportunities you may have missed.
These filters are starting points. As you gain experience, you will naturally refine them based on which setups your strategy targets most effectively.
Now you have the knowledge foundation. But knowing and doing are very different things. How do you actually get started without walking into every beginner mistake in the book?
Day Trading for Beginners: Getting Started
The gap between understanding day trading concepts and executing trades profitably is exactly where most beginners stall. Reading about setups will only take you so far, since real results come from a combination of structure, routine, and deliberate practice built up over months.
Essential Day Trading Tips
If you are just starting out, these tips will save you time, money, and a good deal of frustration:
- Start on a demo account. Paper trading lets you test strategies with real market data and zero financial risk. Spend at least 2-4 weeks here before considering live trading.
- Trade one strategy at a time. Trying to learn momentum trading, scalping, and reversals simultaneously will scatter your focus. Master one approach before layering on another.
- Keep position sizes small when you go live. Your first live trades should use the minimum position size your broker allows, so the priority at this stage is learning how you behave under real financial pressure with limited downside.
- Set a daily loss limit. Decide in advance how much you are willing to lose in a single day (many experienced traders cap this at 1-2% of their account), and when you hit it, stop trading without exception.
- Journal every trade. Record your entry, exit, reasoning, and what you felt during the trade. Patterns in your mistakes will surface faster than you expect. Journaling remains one of the most underrated tools for accelerating your learning curve.
- Focus on process over profits. In the early months, judge yourself on whether you followed your plan and executed cleanly, since consistent execution is what builds consistent results over time.
Building a Day Trading Routine
Consistency in day trading starts well before the market opens. Here is a framework you can adapt to your own schedule:
Pre-Market (30-60 minutes before open):
- Check overnight news and the economic calendar for market-moving events
- Run your stock screener to build a focused 3-5 stock watchlist
- Mark key support, resistance, and VWAP levels on your watchlist charts
- Review your trading plan: which setups will you take today? What is your daily loss limit?
Market Hours (active trading):
- Focus on the first 1-2 hours, the most volatile and opportunity-rich window
- Execute only setups that match your plan; skip everything else
- Take brief notes on trades as they happen
Post-Market (15-30 minutes after close):
- Review every trade in your journal
- Identify what went right and what went wrong
- Adjust your plan for the next session if needed
This routine might feel rigid at first, but structure is what separates traders who improve from those who repeat the same mistakes week after week.
Best Day Traders to Follow for Learning
Learning from experienced traders can accelerate your development, provided you approach it with the right lens. Follow traders who explain their thought process alongside their entries and exits, so you can absorb the decision-making framework behind their trades and apply it to your own setups.
Look for traders and educators who:
- Share both winning and losing trades transparently
- Explain the reasoning behind each trade alongside the outcome
- Emphasize risk management and process over flashy profit screenshots
- Have a verifiable track record or long-standing reputation in the trading community
Be cautious of anyone who makes trading look effortlessly profitable, promises specific returns, or pushes expensive courses with high-pressure tactics. The most credible trading educators are candid about the difficulty and the learning curve involved.
Following any trader does not guarantee results. Use their content as a learning resource, not as a trade signal service.
All the strategy and knowledge in the world means nothing without the one skill that separates survivors from casualties in day trading: risk management.
Risk Management for Day Traders
You can be right on only 40% of your trades and still end up profitable, if your winners are larger than your losers. That is the essence of risk management, and it is the single most important skill a day trader can develop. For a deeper dive, check out our comprehensive risk management guide.
Position Sizing and Stop Losses
Position sizing determines how much capital you allocate to each trade, and it should never come down to a guess. The standard approach is the percentage risk model:
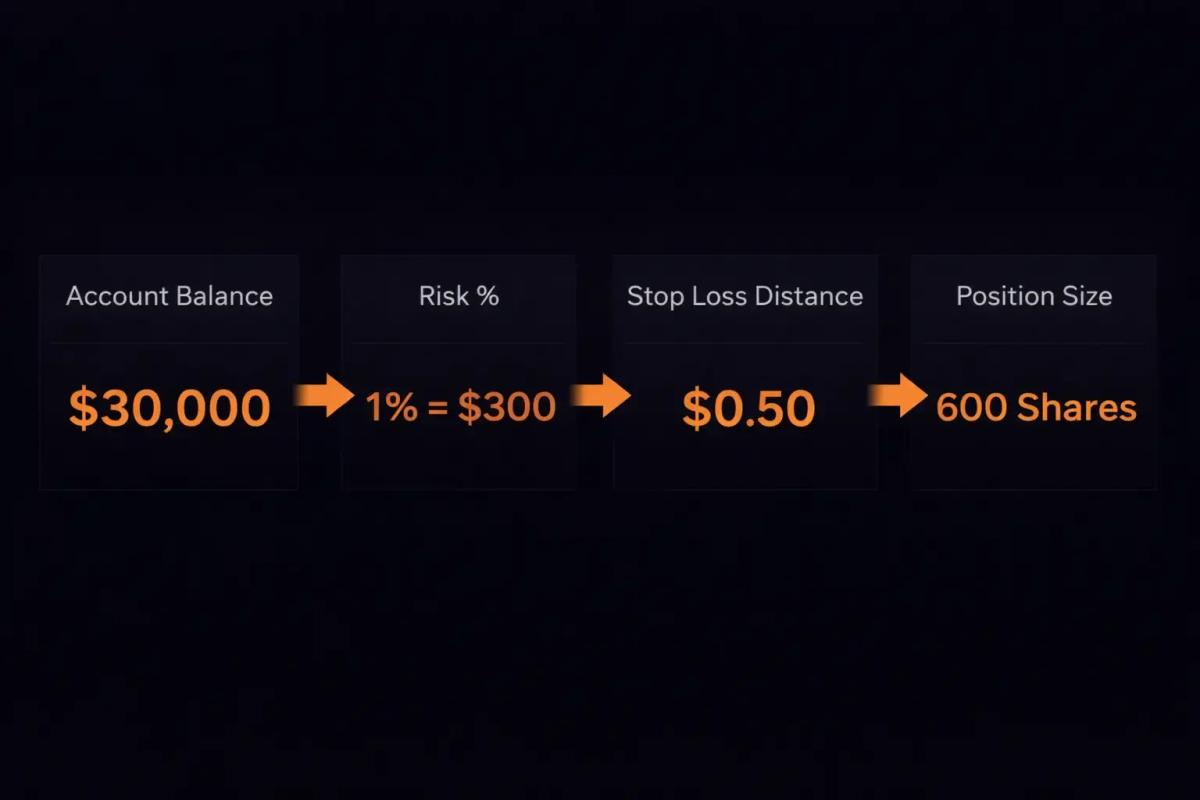
Here is how it works with a concrete example:
- Account size: $30,000
- Risk per trade: 1% ($300)
- Stop loss distance: $0.50 from your entry
- Position size: $300 / $0.50 = 600 shares
This means no matter what stock you are trading or how confident you feel, you are risking the same dollar amount on every trade. The position size adjusts automatically based on how far away your stop loss sits.
Your stop loss is your emergency exit, a predetermined price level where you accept that the trade idea was wrong and cut the loss. Placing one on every trade is non-negotiable, because trading without a stop resembles driving without brakes: it feels fine until it does not.
The Role of Risk-Reward Ratios
The risk-reward ratio compares how much you stand to lose versus how much you stand to gain on a trade. For example, if your stop loss is $0.50 below your entry and your profit target is $1.00 above it, your risk-reward ratio is 1:2.
This ratio has a direct bearing on how often you need to be right just to stay profitable:
- At 1:1 risk-reward, you need to win more than 50% of trades to profit
- At 1:2 risk-reward, you only need to win about 34% of trades to break even
- At 1:3 risk-reward, you can be wrong on two out of three trades and still come out ahead
Most experienced day traders aim for a minimum of 1:2 risk-reward on their setups. This builds in a meaningful margin for error, which every trader needs because nobody wins every trade.
Before entering any position, ask yourself: “Is the potential reward at least twice my risk?” If the answer is no, the setup may not be worth taking, regardless of how clean the chart looks.
Common Mistakes and How to Avoid Them
Even with solid tools and a well-built plan, certain mistakes trip up nearly every new day trader:
- Overtrading: Taking trades out of boredom or FOMO instead of waiting for your setup. Cap the number of trades per day and hold yourself to it.
- Moving your stop loss: Widening your stop to avoid getting stopped out feels logical in the heat of the moment but quietly destroys your risk management.
- Revenge trading: After a loss, immediately jumping back in to “make it back.” Step away from the screen after a losing streak.
- Ignoring the daily loss limit: If you committed to stopping at $300 in losses, stop at $300, since the market will be there tomorrow.
- Over-leveraging: Using maximum margin on every trade is a fast track to a blown account.
- Skipping the journal: Without reviewing your trades, you have no reliable way to identify which parts of your process are working and which are not. The journal is your most powerful feedback loop.
The traders who last are the ones who recognize their patterns and build systems to keep from repeating them, since expecting to eliminate mistakes altogether is a losing proposition from the start.
About the authors


Put this into practice
Brokers we have reviewed
Scored on the same five dimensions. Here are three of them — the full list is on the brokers page.



Related articles

Forex Broker Comparison Metrics to Look Out For

Forex Spread Explained: What It Costs You on Every Trade
A plain-English guide to the forex spread: what it is, how to calculate the cost of one, and how it shapes the profitability of your trading strategy.

How Many Day Traders Are Successful? What the Data Shows
A clear, evidence-based look at how many day traders actually make money, how long they last, and the habits that separate survivors from the majority who quit.
0 comments