Position Trading Guide: Strategies, Indicators, and Timeframes
If you’ve ever felt chained to your screen, watching every tick of a 5-minute chart while your coffee goes cold, you already know that faster trading isn’t always better trading. Position trading offers a different path: you capture large market moves over weeks or months instead of scrambling for scraps on intraday charts.
This position trading guide breaks down the timeframes, indicators, and strategies behind a structured approach to longer-term trading. You’ll learn how to spot trends worth riding, which indicators actually pull their weight on higher timeframes, and how to manage risk when trades stay open for weeks at a stretch.
What Is Position Trading
Most traders get stuck in a cycle of overtrading. Position trading is the antidote to that cycle, and understanding what it really involves is the first step toward deciding if it suits you.
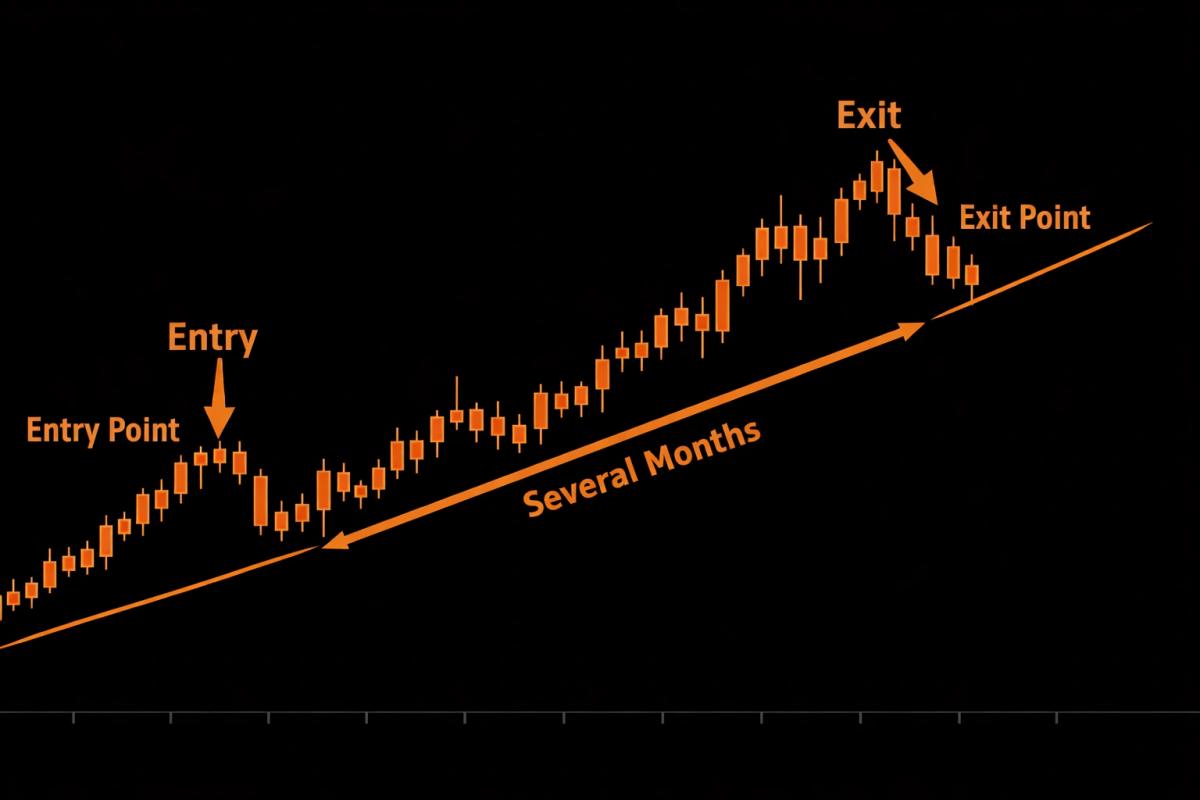
Position trading is a style where you hold trades for weeks to several months, aiming to profit from sustained directional moves. Unlike day trading, where everything closes before the session ends, or swing trading, where you might hold for a few days to a couple of weeks, position trading demands patience and a broader view of price action.
The core idea is simple: identify a strong trend on a higher timeframe, enter at a favorable point, and hold as long as the trend remains intact. Your analysis relies primarily on weekly and daily charts, and your trade management happens in days, not minutes.
Position traders typically check their charts once or twice a day, sometimes less. That makes it one of the least time-intensive active trading styles, though it demands discipline of a different kind. Instead of reacting fast, you need the composure to sit still and trust your analysis while the market works through its noise.
Position Trading vs. Swing Trading vs. Day Trading
The lines between trading styles can blur quickly, so let’s make the distinctions concrete.
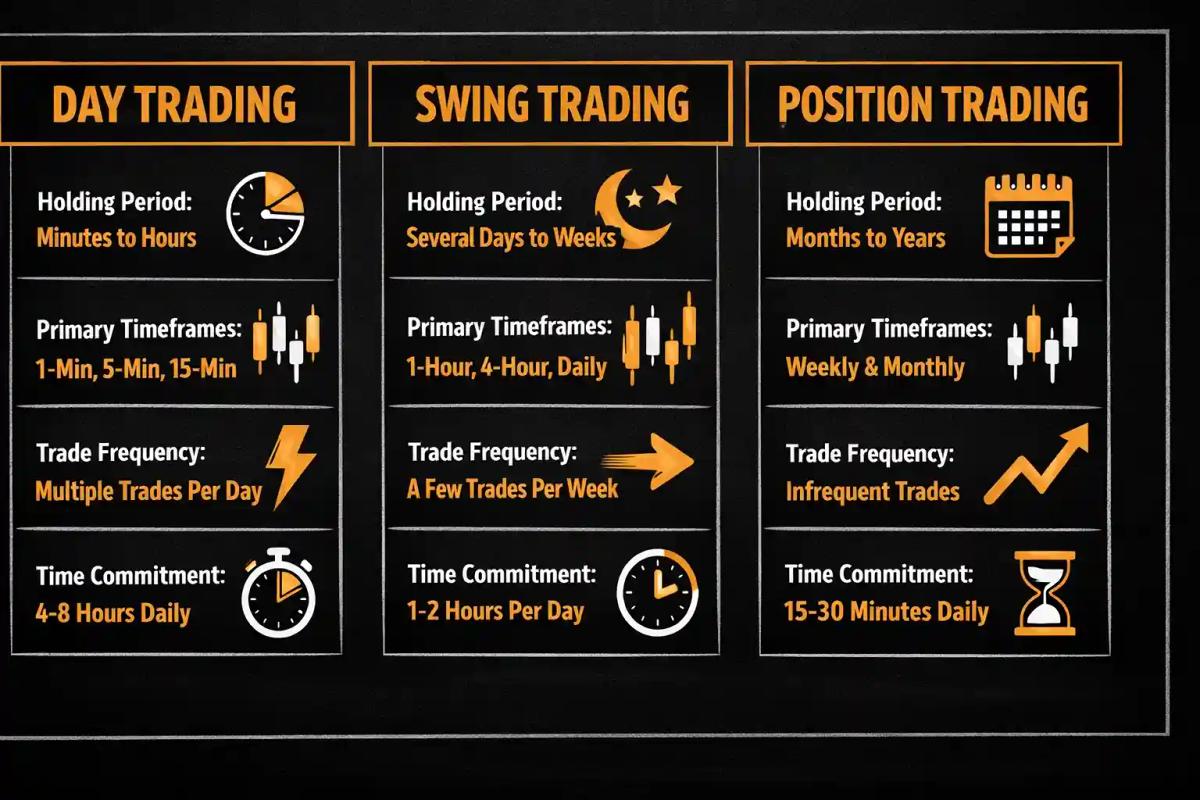
Day trading demands constant attention and rapid decision-making. Swing trading sits in the middle, calling for daily chart reviews and moderate trade management. Position trading operates on the widest lens, where you make fewer decisions but each one carries more weight.
One distinction that often gets overlooked: position trading is not the same as investing. Investors buy assets based on fundamental value and may hold for years with no predefined exit. Position traders use technical analysis, sometimes blended with fundamentals, to enter and exit based on trend structure, with clear stop-losses and profit targets in place. You’re still actively managing risk. You’re just doing it on a longer timeline.
Who Position Trading Is Best Suited For
Position trading tends to work well for you if:
- You have a full-time job or other commitments that prevent you from watching charts all day
- You find the pace of day trading or scalping stressful and unsustainable
- You have the emotional temperament to hold through pullbacks without panicking
- You prefer fewer, higher-conviction trades over high-frequency setups
- You have enough capital to tolerate wider stop-losses without overleveraging
If you’re the type who checks their phone every two minutes after placing a trade, position trading will challenge you. But it might also be exactly what you need to develop a healthier relationship with the market.
So now you know what position trading is and who it’s for. But which timeframes should you actually be watching?
Position Trading Timeframes
Choosing the wrong timeframe is like trying to navigate a road trip using a city street map. You need the right zoom level to see where you’re going, and for position trading, that means thinking bigger than most traders are comfortable with.
Primary Timeframes for Position Traders
Your primary analysis as a position trader lives on two charts:
- Weekly chart: This is your directional compass. The weekly tells you the dominant trend, major support and resistance zones, and the overall market structure. If the weekly doesn’t support your trade idea, the trade doesn’t happen.
- Daily chart: This is your setup chart. You use the daily to identify specific patterns, indicator signals, and entry zones. Most of your technical analysis work happens here.
Some position traders also lean on the 4-hour chart as a timing tool, particularly when they want a sharper entry after the weekly and daily have aligned. Think of it as zooming in just enough to refine your entry without getting lost in noise.
The monthly chart can be useful for added context, especially in forex or commodities where long-term cycles unfold over years. But for most position traders, the weekly and daily combination forms the core framework.
Multi-Timeframe Analysis for Position Trading
Using multiple timeframes is essential for successful position trading. Here’s how it works in practice:
- Start with the weekly chart to determine trend direction. Is price making higher highs and higher lows (uptrend)? Lower highs and lower lows (downtrend)? Or chopping sideways? If there’s no clear trend on the weekly, you either skip the market or wait.
- Move to the daily chart to find your setup. Look for pullbacks to support in an uptrend, rallies to resistance in a downtrend, or breakout patterns forming at key levels.
- Drop to the 4-hour chart (optional) to fine-tune your entry. This helps you get a tighter stop-loss and better risk-reward ratio without changing your trade thesis.
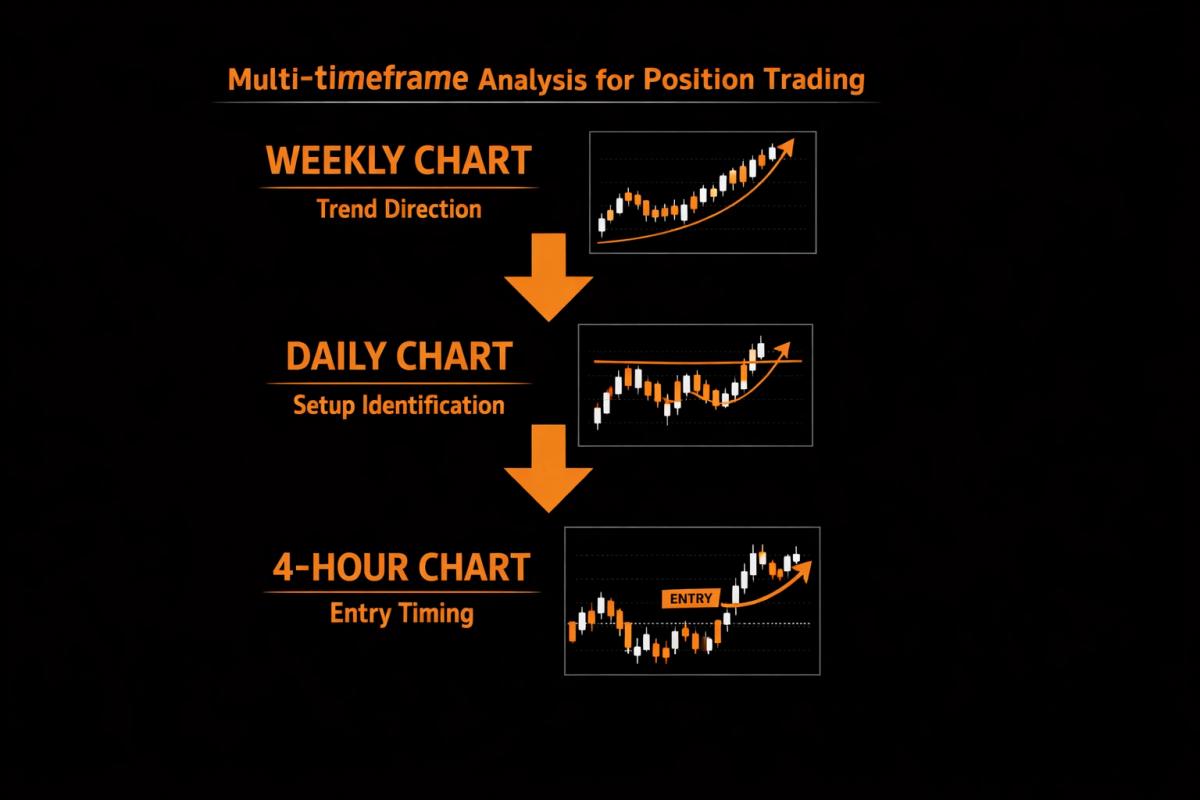
The key principle: higher timeframes set direction, lower timeframes refine timing. Never fight the weekly trend on a 4-hour chart.
With your timeframes locked in, the next question becomes obvious: which indicators help you read those charts effectively?
Best Indicators for Position Trading
Indicators are tools. The right ones, applied to the right timeframes, help you confirm trends, time entries, and sidestep false signals. Too many stacked together just create noise. Here are the indicators that earn their place on a position trader’s chart.
Moving Averages (SMA and EMA)
If you could only use one indicator for position trading, moving averages would be the strongest candidate.
A moving average smooths out price data over a set number of periods, giving you a cleaner picture of the underlying trend. For position trading, longer-period moving averages are your workhorses:
- 50-period SMA or EMA: Acts as a dynamic support/resistance level and trend filter on the daily chart. Price consistently above the 50 MA suggests bullish momentum is intact.
- 200-period SMA: The benchmark for long-term trend direction. When the 50 MA crosses above the 200 MA (a “golden cross”), it’s widely viewed as a bullish signal, and the reverse (“death cross”) as bearish.
The difference between SMA (Simple Moving Average) and EMA (Exponential Moving Average) comes down to responsiveness. The EMA gives more weight to recent price data, so it reacts faster. For position trading, both work well, but many traders prefer the SMA on weekly charts for its stability and the EMA on daily charts for slightly earlier signals.
Think of moving averages as the current of a river. You want to trade in the direction the current is flowing, not paddle against it.
MACD
The MACD (Moving Average Convergence Divergence) is a momentum indicator that reveals when trend strength is building or fading.
It consists of three components: the MACD line (difference between the 12 and 26-period EMAs), the signal line (9-period EMA of the MACD line), and the histogram (a visual representation of the gap between the two).
For position trading, MACD earns its spot because:
- A MACD crossover above the signal line on a weekly chart can confirm the start of a multi-week or multi-month move
- Divergence between MACD and price (price making new highs while MACD makes lower highs) warns you that a trend may be losing steam
- The histogram expanding tells you momentum is accelerating, while contraction suggests it’s cooling off
Don’t use MACD as your sole entry trigger. Instead, treat it as a momentum confirmation layer on top of your trend analysis.
RSI for Long-Term Trend Confirmation
RSI (Relative Strength Index) measures the speed and magnitude of price changes on a scale of 0 to 100. Most traders learn it as an “overbought/oversold” indicator, but for position trading, its real value lies elsewhere.
On higher timeframes, RSI behaves differently than on a 15-minute chart. In strong trends, RSI can stay “overbought” (above 70) for weeks, even months. So rather than using RSI to pick reversals, use it to confirm trend strength:
- In an uptrend, RSI consistently holding above 40-50 confirms bullish momentum
- In a downtrend, RSI staying below 50-60 confirms bearish pressure
- RSI divergence on a weekly chart can serve as a powerful early warning that the trend may be shifting
Here’s the trap most beginners fall into: selling just because RSI hits 70 on a weekly chart. In a strong uptrend, that’s often the worst move you can make.
Fibonacci Retracement Levels
Fibonacci retracement levels give you a framework for identifying where pullbacks are likely to find support or resistance within a larger trend.
The key levels are 38.2%, 50%, and 61.8%. For position trading, these levels work best when applied to major swings on the daily or weekly chart:
- In an uptrend, a pullback to the 50% or 61.8% retracement of the previous leg often provides a high-probability entry zone
- When Fibonacci levels line up with other support/resistance (horizontal levels, moving averages), the confluence strengthens the setup considerably
- The 38.2% level can act as the first area of support in very strong trends
Fibonacci gives you a structured way to anticipate where price might react, rather than guessing in the dark.
How to Combine Indicators for Position Trades
No single indicator tells the full story. The key lies in combining them so that each one confirms a different aspect of the trade.
Here’s a practical combination framework:
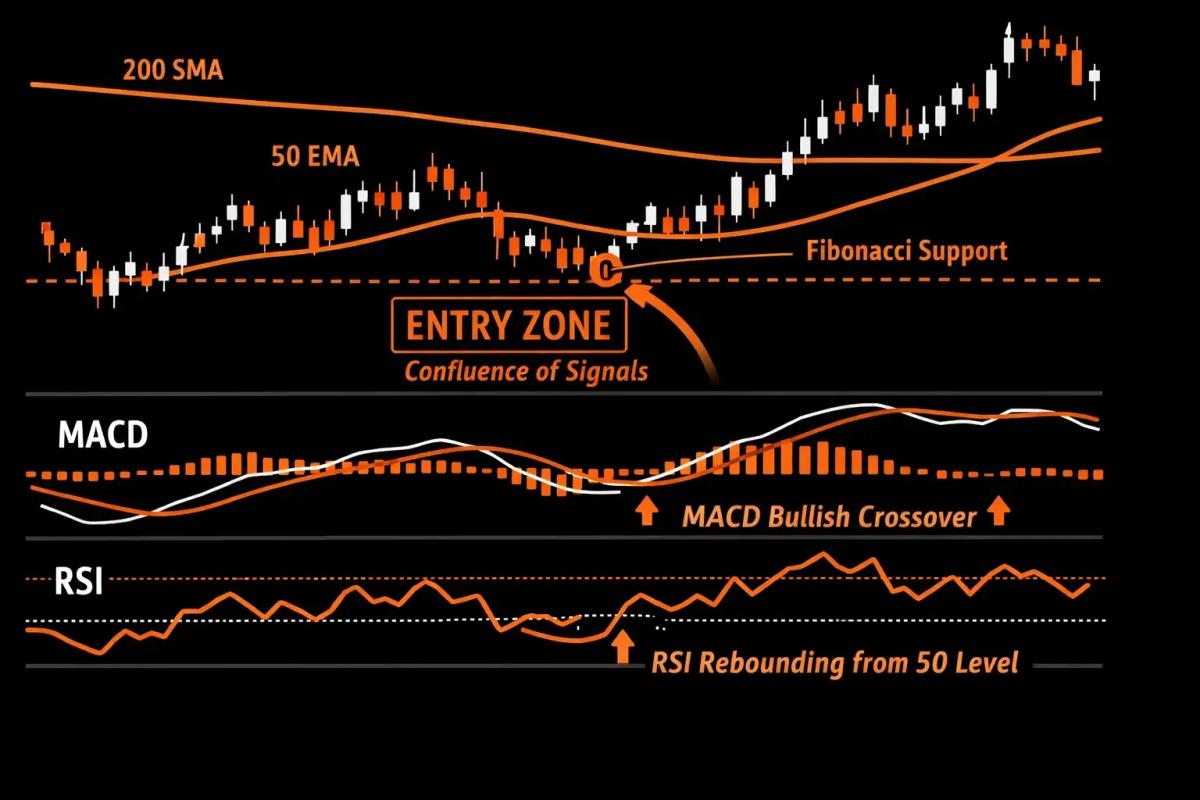
- Trend direction: Price above the 200 SMA on the weekly chart (bullish bias)
- Setup identification: Price pulls back to the 50 EMA on the daily chart and touches a Fibonacci retracement level (61.8%)
- Momentum confirmation: MACD crosses above the signal line on the daily chart, and RSI bounces off the 50 level
- Entry: Enter on the next candle close after confluence is confirmed
This layered approach filters out low-quality signals and keeps you focused on setups where multiple factors agree.
With indicators in your toolkit, it’s time to put them into actual strategies you can execute.
Position Trading Strategies
Knowing when and how to deploy them in a repeatable strategy is what separates study from execution. Here are three proven frameworks for position trading that you can adapt to your preferred markets.
Trend-Following Strategy
This is the bread and butter of position trading, and for good reason. Trends on higher timeframes tend to persist, and riding them remains one of the most reliable ways to capture large moves.
Entry logic:
- Confirm the weekly trend using the 200 SMA (price above it for long, below for short)
- Wait for a pullback on the daily chart to the 50 EMA or a key Fibonacci retracement level
- Confirm momentum with a MACD crossover or RSI bouncing off 50
- Enter with a stop-loss below the recent swing low (for longs) or above the recent swing high (for shorts)
Exit logic:
- Trail your stop-loss below each new higher swing low as the trend progresses
- Take partial profits at a 2:1 or 3:1 risk-reward ratio
- Exit the full position if price closes below the 50 EMA on the daily chart or the weekly trend structure breaks
This strategy performs best in trending markets (forex majors, indices, commodities during strong cycles) and tends to struggle in choppy, range-bound conditions.
Breakout and Retest Strategy
Sometimes the best position trades start with a bang: price breaks through a major level and then pulls back to test it as new support or resistance.
Entry logic:
- Identify a significant horizontal support or resistance level on the weekly chart (the more times price has reacted to it, the stronger the level)
- Wait for a clean breakout, meaning a weekly candle closing convincingly beyond the level
- Be patient for the retest: price often pulls back to the broken level within days to a couple of weeks
- Enter on confirmation that the level is holding (bullish price action at prior resistance now turned support, for example)
Exit logic:
- Stop-loss below the retest level (with a small buffer for noise)
- First target at the next major resistance/support level on the weekly chart
- Trail stop if the trend continues beyond your initial target
The retest is where the real opportunity lies. It gives you a defined risk level and often a better entry price than chasing the initial breakout.
Fundamental-Technical Hybrid Approach
For markets like stocks and forex, combining fundamental context with technical execution can give your position trades a stronger foundation.
How it works:
- Use fundamental analysis to identify the “why” behind a potential move. For stocks, this might be earnings growth, sector strength, or macroeconomic tailwinds. For forex, it could be interest rate differentials or central bank policy shifts.
- Use technical analysis (your indicators and chart structure) to determine the “when” and the “where” for entry and exit.
For example, if a central bank is signaling a rate hike cycle, you have a fundamental reason to look for long setups in that currency. You then turn to the weekly and daily charts with your indicators to find the optimal entry point and manage the trade technically.
This approach requires more research than a purely technical strategy, but it can give you higher conviction on trades that last months.
Strategies alone won’t carry you, though. Your ability to survive the inevitable rough patches determines everything. So how do you protect your capital when trades take weeks to play out?
Risk Management for Position Trading
Position trading might be slower-paced, but it’s not automatically safer. Wider stop-losses, overnight exposure, and the psychological strain of sitting through drawdowns all demand a different approach to risk. Get this wrong, and a single position trade can inflict more damage than a week of bad scalps.
Position Sizing for Longer Holds
This is where most traders migrating from shorter timeframes make their costliest mistake: they keep the same position sizes while widening their stops, effectively multiplying their risk without realizing it.
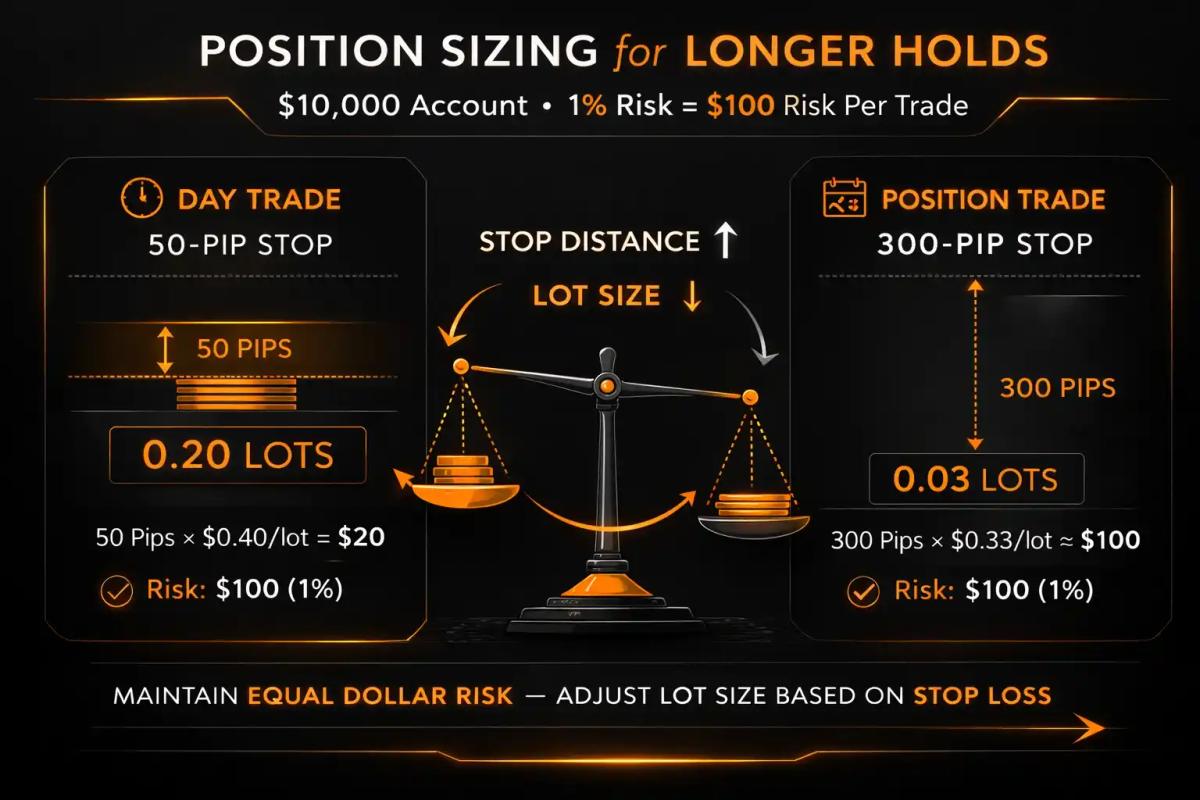
If your risk per trade stays at 1-2% of your account, your position size must shrink as your stop-loss distance grows.
For example:
- A day trade with a 50-pip stop on a $10,000 account risking 1% ($100) might use 0.2 lots
- A position trade on the same pair with a 300-pip stop, risking the same $100, would use approximately 0.03 lots
Same dollar risk, vastly different position sizes. This adjustment is non-negotiable if you want to survive in position trading.
Also consider margin requirements. Holding trades for weeks means your margin is committed for extended periods. Make sure you have enough free margin to absorb drawdowns and avoid margin calls, especially in leveraged markets like forex.
Setting Stop-Losses on Higher Timeframes
Your stop-loss placement must respect the timeframe you’re trading on. A stop that makes sense on a 15-minute chart will get swept by normal daily or weekly price fluctuations.
For position trades, place your stop-loss:
- Below the most recent significant swing low (for longs) on the daily chart
- Beyond a key support or Fibonacci level that, if broken, invalidates your trade thesis
- With enough buffer to account for typical volatility (the ATR, or Average True Range, indicator helps you measure this)
A common approach is to set your initial stop 1 to 1.5x the daily ATR beyond your key level. This gives the trade room to breathe without leaving you unnecessarily exposed.
Managing Drawdowns Over Weeks and Months
Here’s a reality worth accepting before you place a single position trade: you will sit through drawdowns. Price will move against you, sometimes for days, before continuing in your direction.
What helps:
- Pre-define your invalidation level before entering the trade. If price hits that level, you exit. No renegotiating with yourself in the moment.
- Resist the urge to check charts constantly. Once or twice a day is plenty. Over-monitoring invites emotional exits.
- Trust the weekly structure. If the weekly trend is intact and your stop hasn’t been hit, the trade is still working. Pullbacks within a trend are the cost of capturing large moves.
- Keep a trade journal. Record your reasoning at entry so you can revisit it during drawdowns instead of letting fear rewrite your analysis.
Losses are part of this game. The goal is to keep them small relative to your winners.
That covers the risk side. But before you commit fully to this approach, it’s worth looking honestly at what position trading does well and where it falls short.
Advantages and Disadvantages of Position Trading
Every trading style involves trade-offs, and being upfront about them saves you from unpleasant surprises down the road.
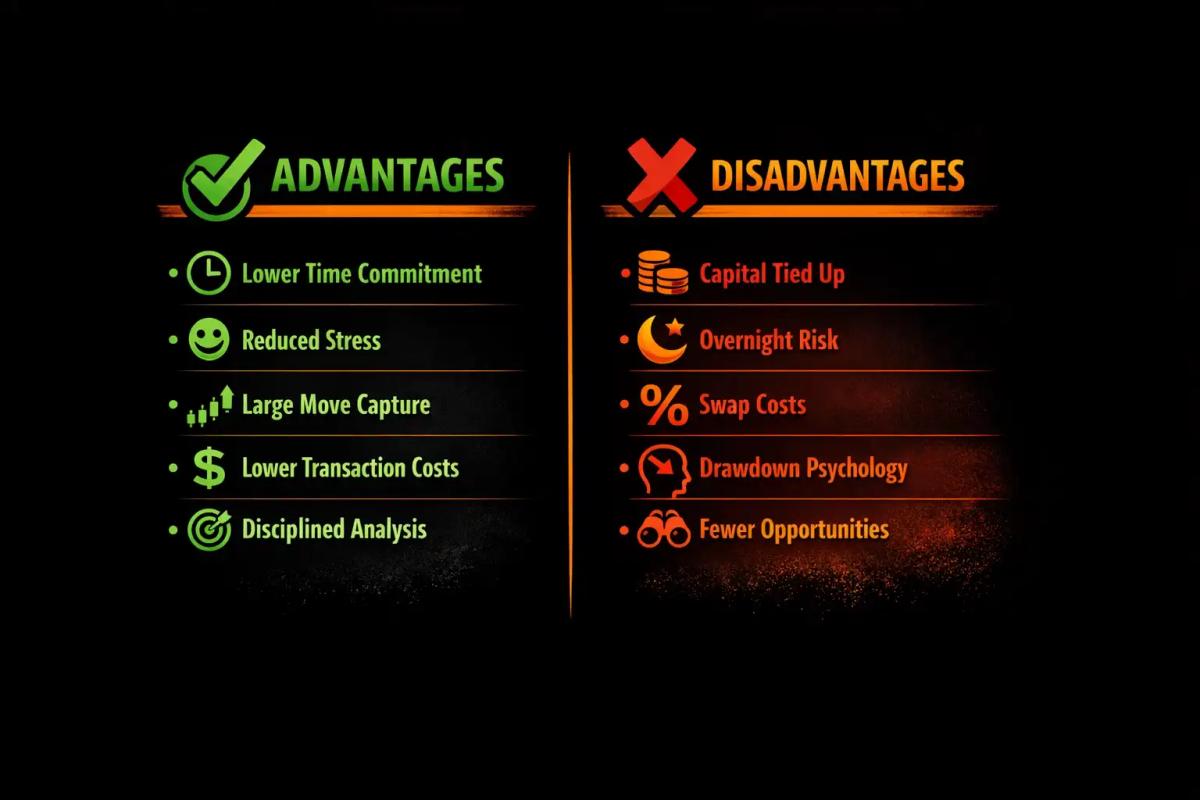
Advantages:
- Lower time commitment: You can manage trades with 15-30 minutes of chart analysis per day, making it compatible with a full-time career or other responsibilities.
- Reduced stress and emotional pressure: Fewer decisions per day means fewer opportunities for impulsive mistakes.
- Captures large moves: Position trades aim for hundreds of pips or significant percentage moves, offering a favorable risk-reward profile on winning trades.
- Lower transaction costs: Fewer trades mean fewer spreads, commissions, and slippage events eating into your bottom line.
- Encourages disciplined analysis: The slower pace forces you to be deliberate about entries and exits rather than reactive.
Disadvantages:
- Capital tied up for extended periods: Your margin is committed to open trades, limiting your ability to jump on other opportunities.
- Overnight and weekend risk: Markets can gap against you on news events that occur while you’re away from your screen.
- Swap and rollover costs: In forex and CFD markets, holding positions overnight incurs swap fees that accumulate over weeks and months, potentially chipping away at profits.
- Psychological challenge of drawdowns: Watching a trade stay red for days or weeks requires emotional resilience that many traders underestimate.
- Fewer trading opportunities: You may go weeks without a valid setup, which can feel frustrating if you’re used to higher-frequency trading.
The question is whether your personality, lifestyle, and capital align with this style’s specific demands.
Ready to put this into action? Let’s talk about how to get started.
How to Get Started with Position Trading
Knowing the theory is valuable, but it means nothing until you build a plan and start executing. Here’s how to move from learning about position trading to actually doing it.
Choosing the Right Market and Instrument
Not every market lends itself equally well to position trading. You want markets that:
- Trend reliably over longer periods: Forex majors (EUR/USD, GBP/USD, USD/JPY), major stock indices (S&P 500, NASDAQ), and commodities (gold, crude oil) tend to form sustained trends that position traders can work with.
- Have sufficient liquidity: High liquidity means tighter spreads and better execution, both of which matter when you’re holding trades for weeks.
- Match your knowledge base: Trade instruments you understand. If you follow macroeconomic news, forex or indices might suit you. If you understand company earnings and sector dynamics, individual stocks or ETFs could be a better fit.
For beginners, starting with one or two instruments is smart. Spread yourself too thin, and you’ll struggle to track setups effectively.
Building a Position Trading Plan
A trading plan is a set of rules you follow so that decisions get made in advance.
Your position trading plan should define:
- Markets and instruments you’ll trade (and those you’ll avoid)
- Timeframes for analysis (weekly for direction, daily for setups, 4H for entries if applicable)
- Indicators you’ll use and how they must align before you enter
- Entry criteria that spell out the specific conditions required before you open a trade
- Stop-loss rules covering where you’ll place your stop and how you’ll calculate position size
- Exit and profit-taking rules including trailing stop methodology, partial profit targets, or time-based exits
- Maximum risk per trade (1-2% of account is a common guideline)
- Maximum open positions at any one time to prevent overexposure
Write this down. Then paper trade or use a demo account to test it before risking real capital. Position trading rewards preparation, and the best way to build confidence is to see your plan work on historical charts and in simulated markets before going live.
Frequently Asked Questions
How much capital do I need to start position trading?
There's no universal minimum, but because position trading uses wider stop-losses, you need enough capital that your position sizes are meaningful without overleveraging. For forex, many traders start comfortably with $2,000 to $5,000. For stocks without leverage, you may need more depending on share prices. The key is that your 1-2% risk per trade translates into a position size that's worth managing.
Does position trading work in forex, stocks, and crypto?
Position trading can be applied to any market that trends over longer periods. Forex and stock indices are the most popular choices due to their liquidity and tendency to form sustained trends. Crypto markets can also be position traded, but their higher volatility and less predictable behavior mean you'll typically need wider stops and smaller position sizes. Start with the market you know best.
How much time per day does position trading require?
Most position traders spend between 15 and 30 minutes per day reviewing charts, checking for new setups, and managing existing positions. On quiet days, especially when no trades are open and nothing is setting up, you may only need a few minutes. That makes position trading one of the most time-efficient active trading styles available.
What's the difference between position trading and long-term investing?
The main difference comes down to intent and methodology. Long-term investors buy assets based on fundamental value and may hold indefinitely with no predefined exit. Position traders use technical analysis (often combined with fundamentals) to enter and exit based on trend structure, with clear stop-losses and profit targets. Position trading is active management on a longer timeframe, not passive holding.
What are the best markets for beginners to position trade?
Forex majors (like EUR/USD or USD/JPY) and major indices (like the S&P 500) are strong starting points. They offer high liquidity, relatively stable trending behavior, and plenty of educational resources. Starting with one or two instruments lets you develop familiarity with their price behavior before expanding your watchlist.
How do swap and overnight fees affect position trades?
In forex and CFD markets, you pay a swap fee each night you hold a position. Over weeks or months, these fees can accumulate and reduce your net profit. Before entering a trade, check the swap rates for your instrument and direction (long vs. short). In some cases, you may actually receive a positive swap for holding in a particular direction, which can work in your favor.
Can I combine position trading with swing trading or day trading?
Yes, and many traders take a hybrid approach. For example, you might hold core position trades on the weekly/daily timeframe while taking shorter-term swing trades on the 4-hour chart. The important thing is to keep the strategies separate in your tracking and risk management so one style doesn't bleed into the other. Define clear rules for each and manage them as independent setups.
About the authors


Related articles
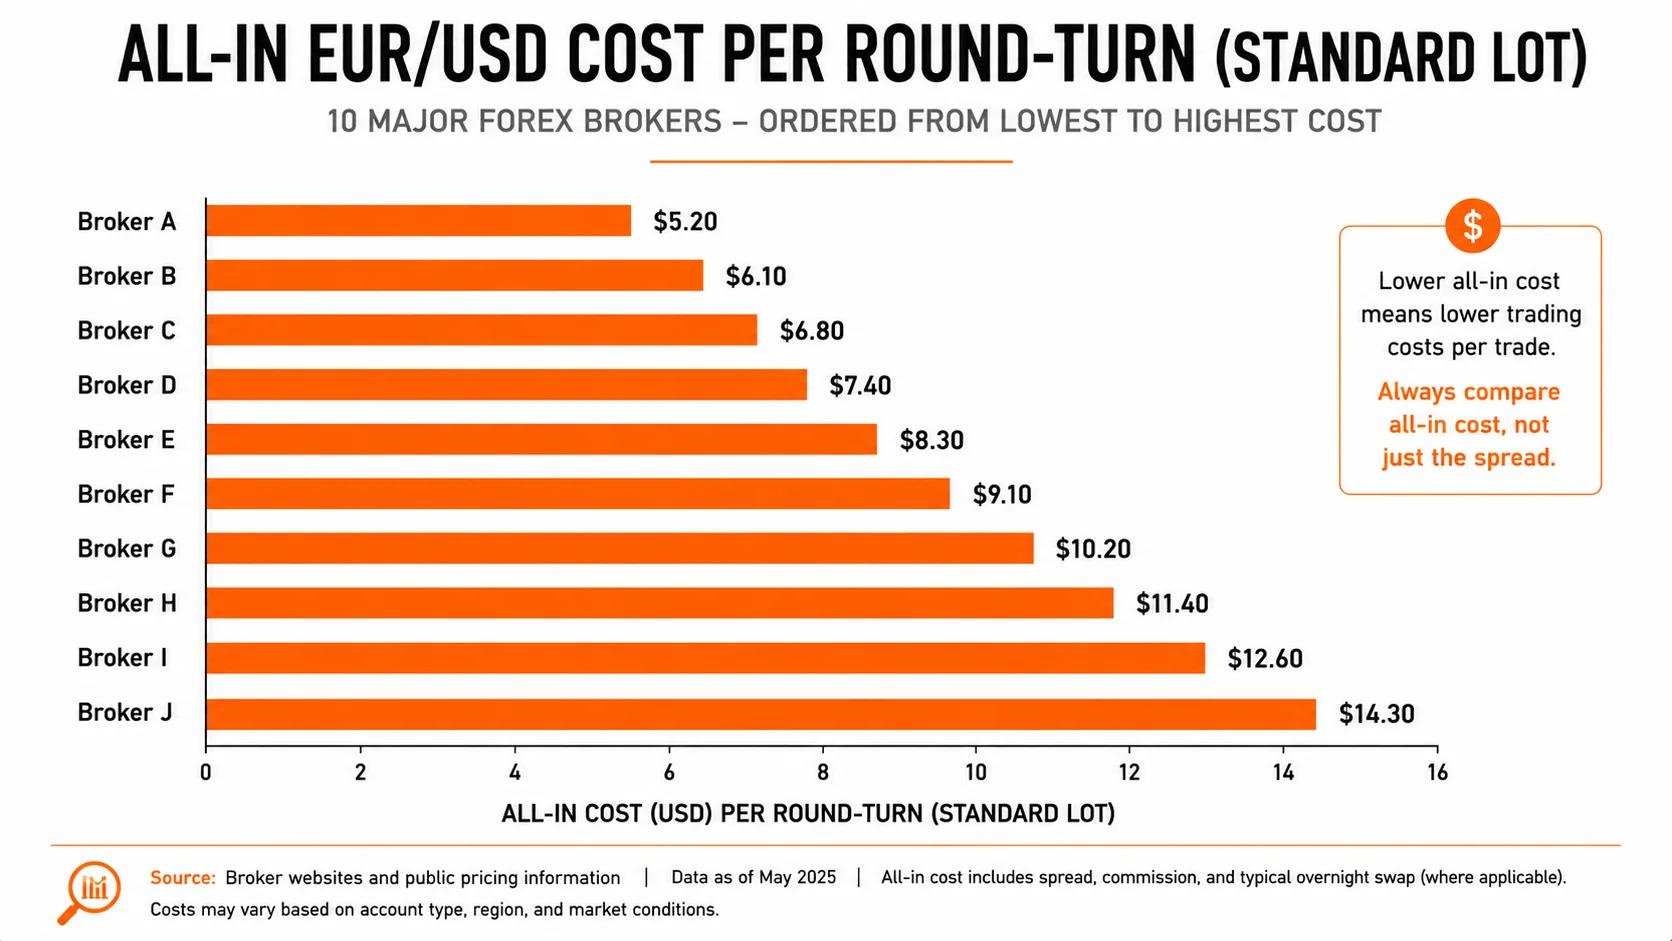
The True Cost of Trading: A Data-Driven Comparison Across 10 Forex Brokers
Full-cost comparison across spreads, commissions, swap rates, and fees for 10 major forex brokers; including EUR/USD, GBP/USD, and Gold trading costs per lot.

7 Moments to Be Bullish on Gold (When to Buy Gold and Why It Matters)
Discover 7 key moments that signal when to buy gold, from real rate shifts to dollar weakness and central bank demand.

Best Day Trading Platforms: Features, Fees, and Execution Speed Compared
A structured comparison of the best day trading platforms: execution latency, spreads, FCA leverage caps, tax reporting, and the psychological tooling that separates disciplined traders from
0 comments