


Scalping Trading Complete Guide: Strategies, Timeframes, and Indicators That Actually Work
Most traders who try scalping quit within weeks because they dive in without a plan, stare at a 1-minute chart drowning in noise, and start clicking buttons on instinct.
Scalping trading sits among the fastest and most unforgiving styles in the markets, with traders entering and exiting positions in seconds or a few minutes to harvest small moves over and over. With clear rules, a suitable timeframe, and indicators you genuinely understand, the process becomes repeatable, while a sloppy version of the same approach is one of the quickest ways to drain an account.
This guide breaks down how scalping works in practice. You’ll find specific timeframe guidance, indicator setups with real parameter values, two step-by-step strategies you can test in your next session, and the risk management rules that keep scalpers solvent long enough to actually improve.
Disclaimer: This content is for educational purposes only and does not constitute financial advice. Trading involves significant risk of loss. Never trade with money you can’t afford to lose, and always practice on a demo account before risking real capital.
What Is Scalping Trading and Why Do Traders Choose It
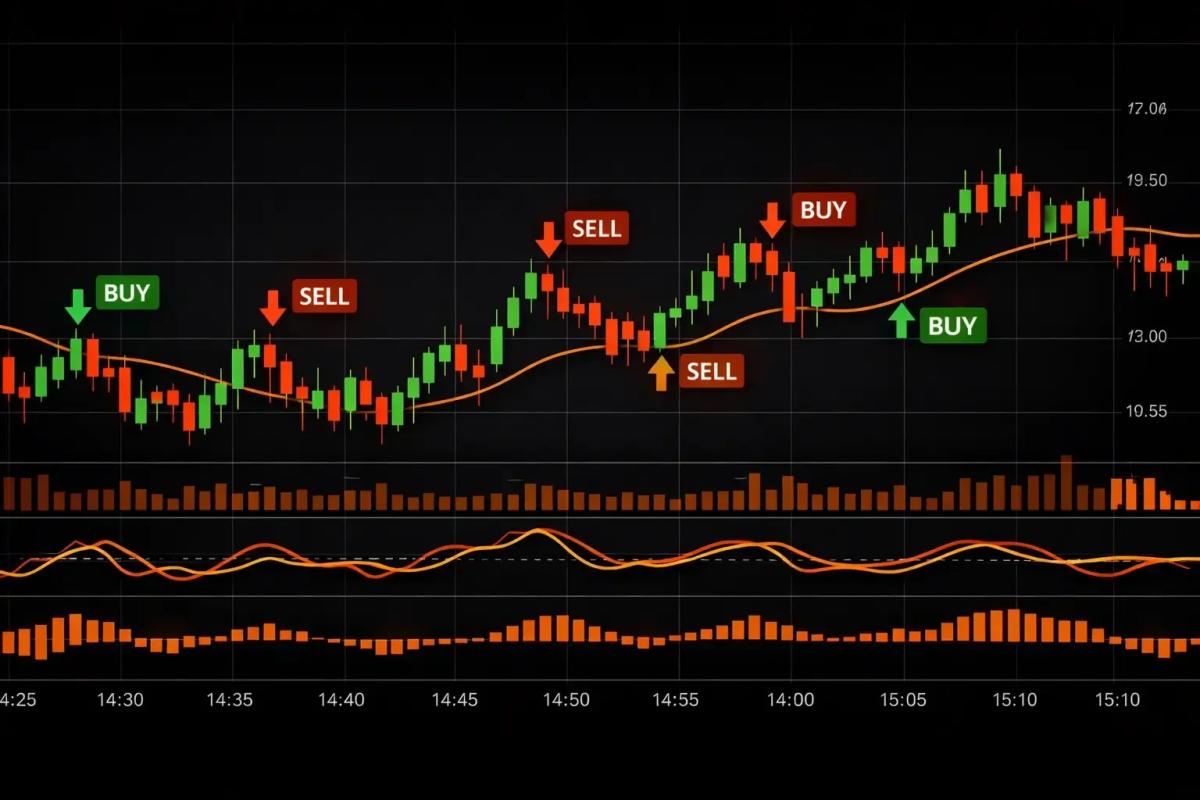
Scalping is about extracting small, consistent profits from tiny price movements. You hold positions for seconds to minutes, reading short-term momentum, getting in, grabbing a few pips or ticks, and getting out before the market turns against you.
Each session hands you dozens of opportunities, and you stay actively engaged, making decisions in real time while your exposure window remains razor-thin. Surprise news events and overnight gaps rarely catch you off guard, because by the time they unfold you are usually already out of the market.
That speed carries real costs, since scalping demands intense focus, fast execution, and airtight risk management, and a single careless trade can easily undo ten good ones. Take the time to weigh that trade-off before you commit to this style.
How Scalping Differs from Day Trading and Swing Trading
The boundaries between these styles blur easily, so a sharper comparison helps.
- Scalping: Trades last seconds to minutes. You target 3–10 pips per trade in forex (or equivalent in other instruments). You might take 15–50+ trades in a single session. You use 1-minute, 5-minute, or tick charts.
- Day trading: Trades last minutes to hours. You target 20–100+ pips per trade. You might take 2–8 trades per day. You typically use 5-minute to 1-hour charts.
- Swing trading: Trades last days to weeks. You target larger moves (100+ pips). You take a handful of trades per week. You use 1-hour to daily charts.
The real distinction lies in how risk is structured. Scalpers accept a smaller reward per trade and compensate with volume and a higher win rate, while day traders and swing traders take fewer positions and chase bigger individual payoffs. Each approach suits different personalities, schedules, and risk tolerances, and none of them is inherently superior to the others.
Who Scalping Is Best Suited For
Scalping suits some temperaments much better than others. You are likely a good fit if the following qualities describe you:
- You can hold focus for extended stretches without drifting.
- You can make rapid decisions without second-guessing yourself.
- You can absorb losing streaks without going on tilt.
Scalping tends to be a poor match for traders who show any of the following tendencies:
- A tendency to overtrade when frustrated.
- Vulnerability to screen fatigue over long sessions.
- A preference for studying each trade carefully before committing.
Scalping also demands a platform with fast execution and low spreads, which quietly rules some brokers out of consideration altogether.
An honest self-assessment here is worth more than any strategy, because even the best scalping system ever designed will not save a trader whose temperament clashes with the pace.
With that temperament check in mind, the first practical decision in front of you is choosing your timeframe.
Ready to start? See our pick of the best forex brokers for beginners.
Best Timeframes for Scalping
Choosing the wrong timeframe is the most common early mistake in scalping. A timeframe that moves too fast will drown you in noise, while one that moves too slowly pushes you into day-trading territory with uncomfortably tight stops. Understanding what each timeframe offers, and what it costs, forms the foundation everything else builds on.
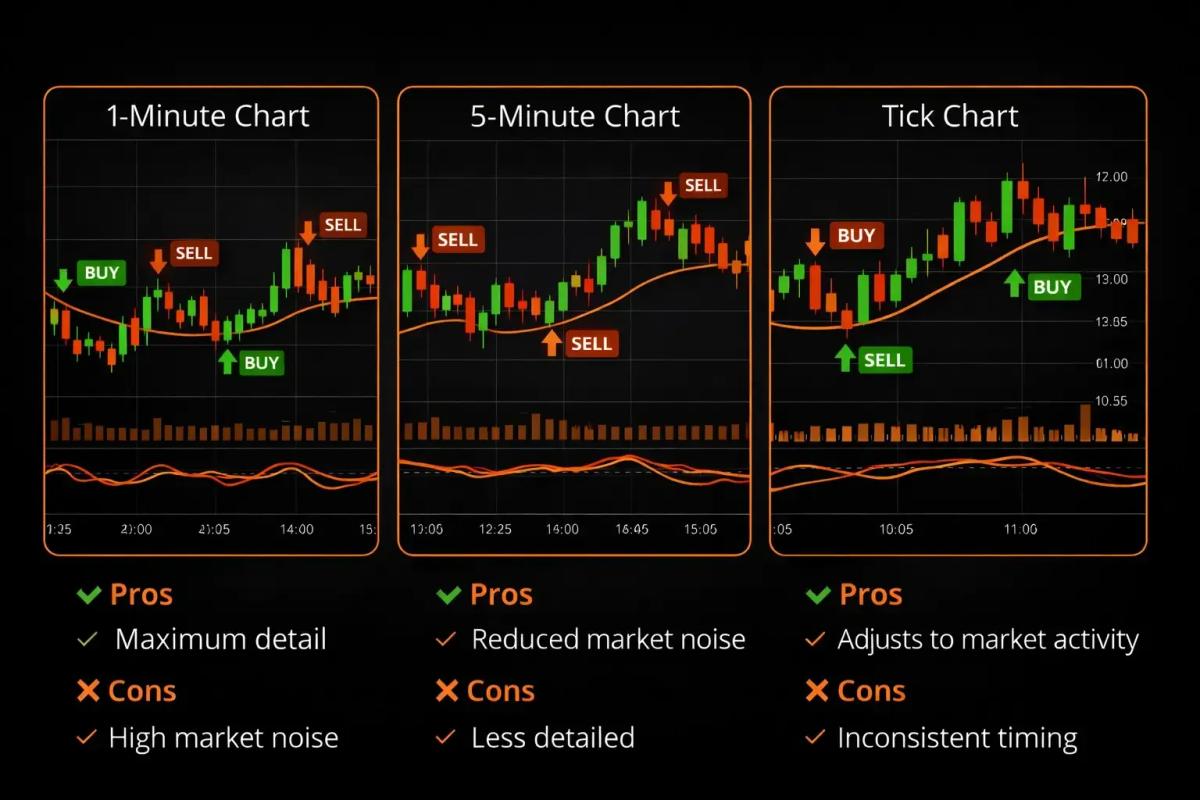
The 1-Minute Chart: Speed, Noise, and When It Works
The 1-minute chart is the classic scalping timeframe, and for good reason. It delivers the most trade opportunities per session and lets you catch very short-term momentum shifts before they surface on higher timeframes.
There is a catch, though: 1-minute charts are noisy, because every random tick and every minor order flow fluctuation shows up as its own candle. Without a clear system for filtering that noise, an entire session can disappear into chasing phantom signals.
The 1-minute chart works best when you combine these conditions:
- You’re trading during high-liquidity periods (the London and New York session overlap, roughly 8:00 AM to 12:00 PM EST for forex)
- You’re on major pairs like EUR/USD or GBP/USD where spreads are tightest
- You pair it with at least one confirmation indicator to filter entries
Outside of peak hours, the 1-minute chart becomes unreliable, as spreads widen, price action turns choppy, and win rates drop noticeably.
The 5-Minute Chart: The Balance Between Speed and Clarity
Where the 1-minute chart feels like a firehose, the 5-minute chart behaves more like a focused stream. You still find plenty of scalping opportunities, and each candle carries more meaningful price information, which translates to fewer false signals, cleaner setups, and more breathing room before you commit.
For beginner and intermediate scalpers, the 5-minute chart is usually the stronger starting point. You’ll take fewer trades per session (perhaps 5–15 instead of 20–50), but your accuracy tends to improve because you’re not reacting to every minor fluctuation.
The 5-minute chart also holds up better during moderate-liquidity periods. You can scalp the London session open or the New York session with reasonable results, even outside the overlap window.
Tick Charts: What They Are and When to Use Them
Tick charts form a candle every N transactions, for example every 133 ticks or every 233 ticks. A useful way to think of them is as a heartbeat monitor for the market: when activity surges, candles form rapidly, and when things quiet down, they slow to a crawl.
This makes tick charts particularly effective at filtering out dead zones. During low-activity stretches, you simply don’t get new candles, so you’re not tempted to trade noise. During high-activity bursts, you get granular data that time-based charts might compress into a single candle.
Tick charts see the most use in futures markets (especially the E-mini S&P 500 and Nasdaq futures) and require platforms that support tick data feeds. MT4’s native tick chart support is limited, so you’d typically need a platform like NinjaTrader or Sierra Chart for proper tick-based scalping.
For most retail forex scalpers, tick charts tend to serve better as an advanced tool to grow into once the basics are solid, and they are seldom the ideal starting point for someone still learning the ropes.
How to Choose the Right Scalping Timeframe
The following framework offers a practical way to decide:
- Choose 1-minute if you’re experienced with fast execution, trade during peak liquidity hours, and want maximum trade frequency.
- Choose 5-minute if you’re newer to scalping, prefer fewer but cleaner setups, or trade during moderate-liquidity sessions.
- Choose tick charts if you trade futures, have a platform that supports tick data, and want analysis built around market activity instead of fixed time intervals.
A sensible starting point for most traders is the 5-minute chart. If it feels too slow after a few weeks of steady practice, stepping down to the 1-minute is reasonable, and traders in futures markets can experiment with tick charts on a demo account before committing real capital.
With a chart choice settled, the next question is what to put on it.
Best Indicators for Scalping
Indicators are where most aspiring scalpers lose their way, often by stacking five or six on a chart, drowning in conflicting signals, and freezing when a decision is needed. A related trap is cherry-picking the single signal that confirms the trade they already wanted to take.
A better aim is to run two or three indicators that complement each other and together deliver a clear yes-or-no verdict on every setup.
Moving Averages for Scalping Entries and Exits
Moving averages serve as your trend filter. On a scalping chart, they reveal the short-term direction so you’re not fighting momentum.
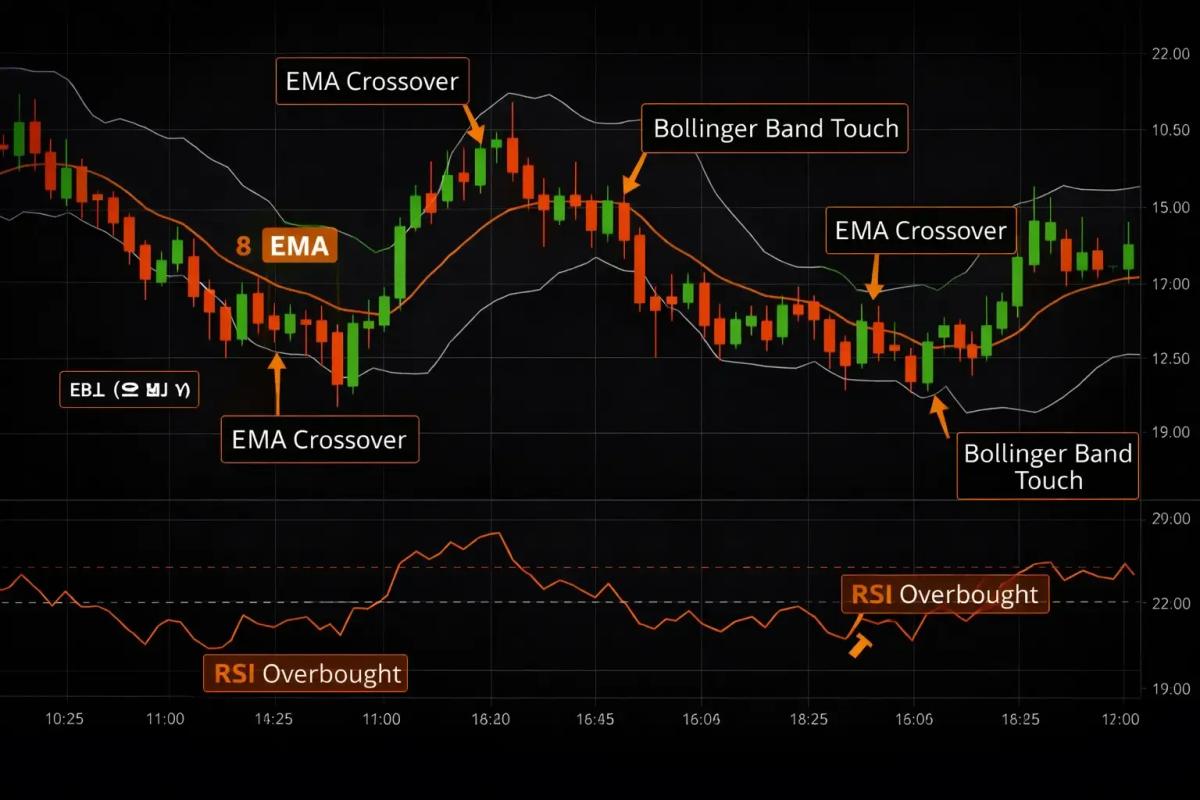
For scalping, exponential moving averages (EMAs) respond faster than simple moving averages (SMAs), which makes them the better fit. A proven and effective pairing:
- 8-period EMA (fast line): Tracks immediate price momentum
- 21-period EMA (slow line): Tracks the short-term trend
When the 8 EMA sits above the 21 EMA, long entries are the only ones worth considering, and when it sits below, only shorts belong on the table. The crossover itself can also act as a signal, though on 1-minute charts crossover signals in isolation produce too many false entries, so additional confirmation becomes essential.
RSI and Stochastic for Overbought/Oversold Scalping Signals
The Relative Strength Index (RSI) and the Stochastic Oscillator are momentum indicators that help you identify when a short-term move has likely exhausted itself.
For scalping:
- RSI settings: Period 7 (faster than the default 14). Overbought level at 80, oversold level at 20. On a 1-minute chart, default RSI (14) reacts too slowly to catch scalping-speed reversals.
- Stochastic settings: %K period 5, %D period 3, slowing 3. Overbought at 80, oversold at 20.
These indicators work best as confirmation of entries that your trend tools have already suggested. Imagine that your EMAs point to a short-term downtrend and RSI is climbing above 80: that reading reinforces the bearish directional bias and flags a potential short entry rooted in your moving-average signal.
VWAP and Bollinger Bands for Mean Reversion Scalping
Mean reversion scalping rests on a straightforward idea: price tends to snap back to an average after short-term extremes. A pair of tools makes this approach workable in practice.
VWAP (Volume Weighted Average Price) shows the average price weighted by volume for the current session. Institutional traders watch VWAP closely, which turns it into a natural magnet for price. When price pushes well above VWAP, a short scalp back toward it carries a statistical edge, and vice versa.
Bollinger Bands (settings: 20 period, 2 standard deviations) build a dynamic envelope around price. When a candle touches or pierces the upper band during a range-bound market, it flags a potential short scalp. A touch of the lower band flags a potential long.
The critical nuance is that mean reversion scalping only holds up in ranging or low-trend conditions, because in a strongly trending market price will ride the bands while VWAP lags behind, which leaves a trader fading a trend and absorbing one loss after another.
Scalping Indicator Setups for MT4
If you’re using MetaTrader 4, here’s how to configure a practical scalping indicator layout:
- Add EMA (8): Insert > Indicators > Trend > Moving Average. Set period to 8, method to Exponential, apply to Close. Color it blue or green.
- Add EMA (21): Same path. Set period to 21, method to Exponential. Color it red or orange.
- Add RSI (7): Insert > Indicators > Oscillators > Relative Strength Index. Set period to 7. Adjust overbought/oversold levels to 80/20.
- Add Bollinger Bands (20, 2): Insert > Indicators > Trend > Bollinger Bands. Period 20, deviation 2.
Save this as a template (Chart > Template > Save Template) so you can apply it instantly to any chart. Keep your chart clean: use a dark background with high-contrast candle colors, and strip away any elements that don’t directly inform your entry or exit decisions.
With your indicators configured, let’s build the actual strategies.
1-Minute Scalping Strategy (Step-by-Step)
This strategy pairs trend direction with momentum confirmation, and it is built for high-liquidity sessions and performs best on major forex pairs. Steer clear of it during Asian session hours and around major news releases, since the noise around those windows will overwhelm your signals.
Entry Rules
For a long entry:
- The 8 EMA must be above the 21 EMA (confirming short-term uptrend).
- Price pulls back to touch or come within 1–2 pips of the 8 EMA.
- RSI (7) reads between 30–50 during the pullback (confirming the pullback isn’t a reversal).
- Enter long when a bullish candle closes above the 8 EMA after the pullback.
For a short entry:
- The 8 EMA must be below the 21 EMA (confirming short-term downtrend).
- Price pulls back up toward the 8 EMA.
- RSI (7) reads between 50–70 during the pullback.
- Enter short when a bearish candle closes below the 8 EMA after the pullback.
Exit Rules and Stop-Loss Placement
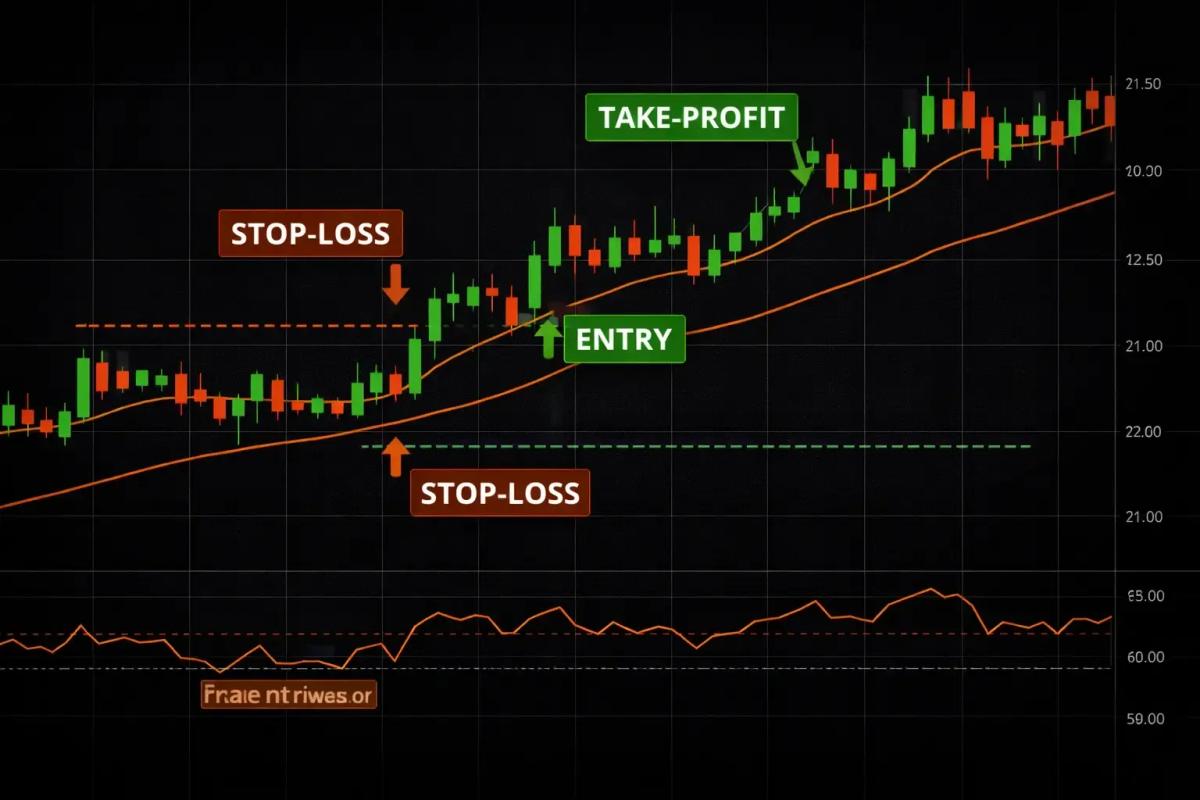
- Stop-loss: Place your stop 3–5 pips beyond the 21 EMA (above for shorts, below for longs). This gives the trade room to breathe without exposing you to outsized risk.
- Take-profit: Target 5–8 pips, or exit when price reaches the opposite Bollinger Band if you have bands on the chart.
- Time stop: If the trade hasn’t moved in your favor within 3–5 candles (3–5 minutes), close it at market. Stalled trades tie up both your capital and your focus.
Your risk-to-reward ratio on this strategy typically runs around 1:1.5 to 1:2. That’s workable for scalping because a well-executed version of this setup can produce a win rate around 55–60%, though your individual results will depend heavily on market conditions and execution quality.
When to Avoid This Strategy
Stay flat during these conditions:
- First and last 15 minutes of a major session (spreads spike, liquidity behaves erratically)
- During or within 5 minutes of high-impact news events (NFP, FOMC, CPI releases)
- When the 8 and 21 EMA are nearly flat and tangled together (no clear trend direction)
- When your spread exceeds 1.5 pips on your trading pair
Whenever conditions leave you uncertain about whether to trade, treat that uncertainty itself as a signal to stay out.
Slowing the pace slightly produces a different picture, which is where the 5-minute version of this approach comes in.
5-Minute Scalping Strategy (Step-by-Step)
The 5-minute strategy follows the same core logic as the 1-minute version while giving you more room to operate, with cleaner signals, fewer false entries, and more time to assess before pulling the trigger. Many intermediate scalpers find their rhythm here, somewhere between the pace of fast scalping and the patience of day trading.
Entry Rules
For a long entry:
- The 8 EMA is above the 21 EMA on the 5-minute chart.
- Price touches or bounces off the lower Bollinger Band (20, 2) while the EMAs still tilt upward.
- Stochastic (%K 5, %D 3, slowing 3) crosses upward from below the 20 level.
- Enter long on the candle close following the Stochastic crossover.
For a short entry:
- The 8 EMA is below the 21 EMA.
- Price touches or bounces off the upper Bollinger Band.
- Stochastic crosses downward from above the 80 level.
- Enter short on the candle close following the Stochastic crossover.
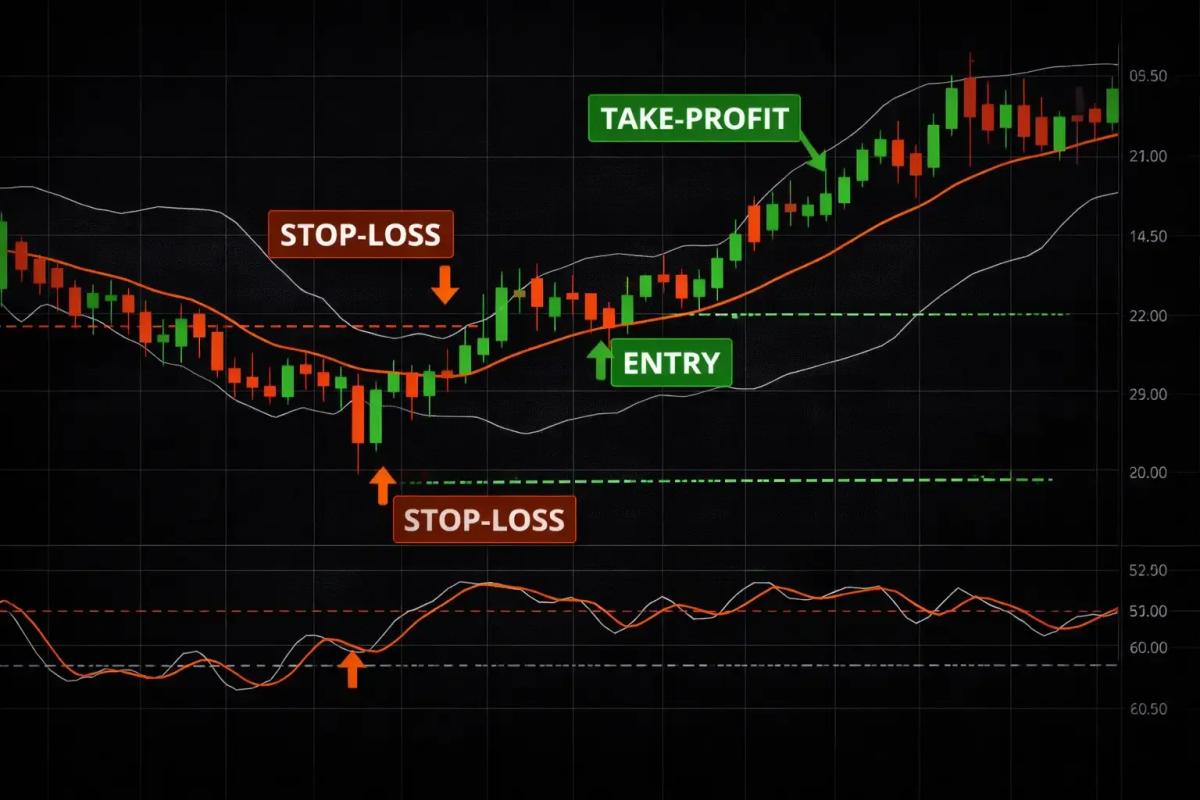
Exit Rules and Stop-Loss Placement
- Stop-loss: Place your stop 7–10 pips beyond the entry candle’s high (for shorts) or low (for longs).
- Take-profit: Target 10–20 pips, or exit when price reaches the middle Bollinger Band (the 20-period moving average).
- Trailing option: Once the trade moves 8+ pips in your favor, you can trail your stop to breakeven and let the position run toward the opposite band.
This setup naturally yields a stronger risk-to-reward ratio than the 1-minute strategy (often 1:2 or better), which means you can remain profitable with a win rate around 45–50%, provided you manage entries and exits consistently.
When to Avoid This Strategy
- During very low volatility when the Bollinger Bands are tightly compressed (this signals a potential breakout, not a mean reversion opportunity)
- When EMAs are flat and crisscrossing repeatedly (no trend to lean on)
- During major economic announcements
- Late in the trading session when volume is thinning out
Both the 1-minute and 5-minute strategies depend on you respecting the market's rhythm. For traders who prefer to anchor their decisions in live market activity, with less emphasis on fixed time intervals, tick scalping offers an alternative lens.
Tick Scalping: How It Works in Practice
Tick scalping removes the time element entirely and zeroes in on pure market activity. It’s a different lens for reading price, and for certain instruments and conditions, it surfaces patterns that time-based charts obscure completely.
Setting Up Tick Charts
To use tick charts, you need a platform that supports tick data. NinjaTrader and Sierra Chart are the most widely used options for futures scalping. In these platforms, you select a tick count for your chart. Common choices include:
- 133 ticks or 233 ticks for the E-mini S&P 500 (ES)
- 144 ticks (Fibonacci-based) for Nasdaq futures (NQ)
- 89 ticks for faster, more granular analysis
The tick count you choose determines how many transactions build each candle. Lower counts give you finer detail (more candles, faster updates), while higher counts smooth the data out.
Your indicator setup on tick charts can mirror what you’d use on time-based charts. EMAs, Bollinger Bands, and volume-based indicators all translate. The key difference is that your signals will compress during active stretches and spread out during quiet ones.
Reading Price Action on Tick Data
On tick charts, watch how quickly candles form. Rapid formation means high activity, and that means your signals carry more weight because real volume is driving the moves. When candle formation slows to a trickle, the market is quiet and you should step back.
Volume spikes on tick charts are especially telling. A sudden burst of large-bodied candles with heavy volume often precedes a directional move. If your trend indicators align with that volume spike, you’re looking at a high-conviction scalp entry.
One important caveat is that tick data feeds can vary between brokers and platforms, so what you see on one platform may not match another exactly. The practical fix is to stay with a single platform long enough to learn its behavior, which produces more reliable reads than bouncing between data sources.
Whichever timeframe or chart type you settle on, none of it holds together without disciplined risk management underneath.
Risk Management Rules for Scalpers
An uncomfortable truth sits beneath every surviving scalping career: the edge is thin. A typical setup targets a few pips per trade with a win rate that might sit around 55–65%, and that edge only compounds into real returns when risk management is airtight, because a single oversized loss or one revenge trade can erase an entire session’s gains.
Position Sizing for Scalping
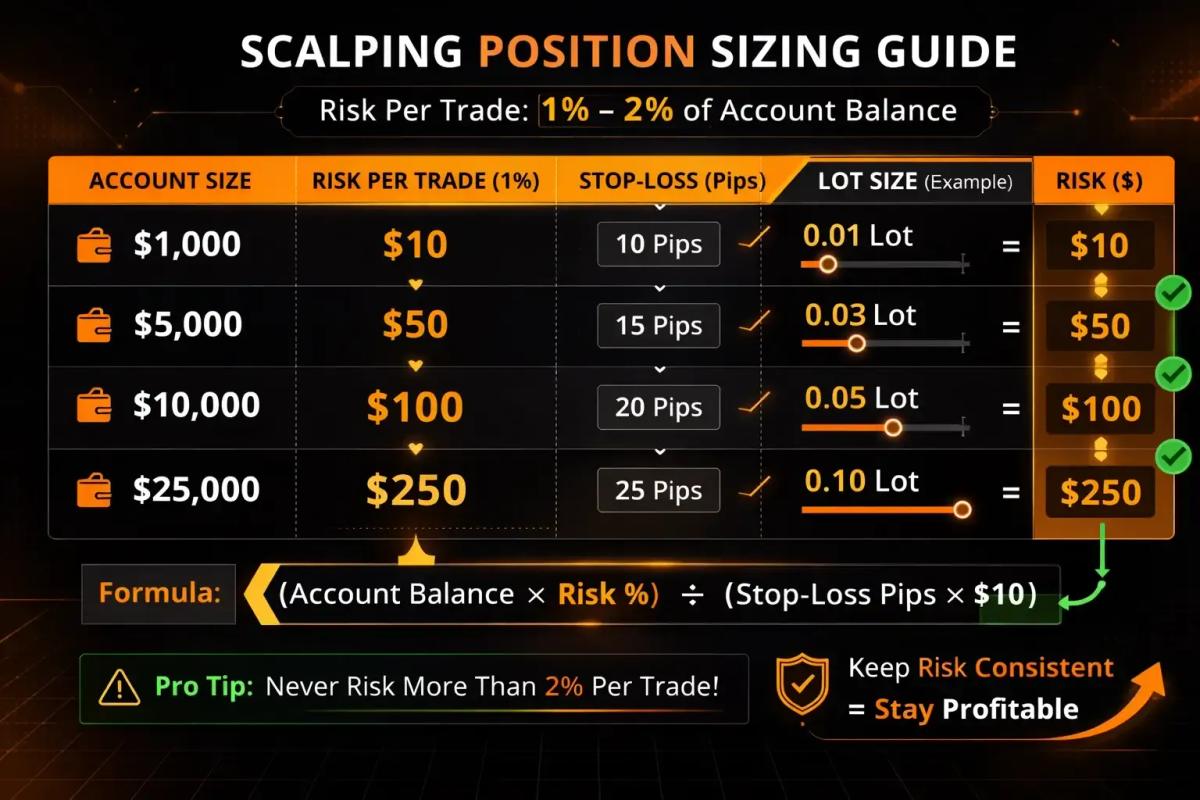
The golden rule is to risk no more than 0.5–1% of your account per trade. For scalping, staying closer to 0.5% is the wiser choice because you’re placing many trades per session, and a string of losses compounds quickly.
A concrete illustration helps make the rule tangible. Picture a $10,000 account where you have decided to risk 0.5% per trade, which comes to $50 of risk. If your stop-loss on EUR/USD is 5 pips away from entry, your position size works out to roughly 1 mini lot (10,000 units), so a 5-pip move against you costs about $50 and your account survives the loss comfortably.
Calculate your lot size before every trade based on your stop distance. Never adjust it mid-trade, and never add to a losing position.
Managing Losses and Drawdowns in Fast Markets
Set a daily loss limit and honor it without exception. A widely used rule is to stop trading for the day if you lose 2–3% of your account, or after three consecutive losing trades, whichever hits first.
The three-loss cutoff exists because, by the third consecutive loss, mental state has usually shifted toward trading from frustration and away from any coherent plan. Walking away at that point is often the most profitable decision available on a losing day.
Tracking performance by session carries real weight alongside tracking individual trades, and many scalpers discover they perform well during certain hours and poorly during others. Should you consistently bleed money during the New York afternoon, for example, the sensible move is to stop trading that window entirely, because your edge is time-dependent and your risk approach should reflect that reality.
Common Scalping Mistakes and How to Avoid Them
Every scalper stumbles early on, and what separates traders who last from those who do not is how quickly they spot and correct the patterns below.
- Overtrading out of boredom. When no valid setup is on the screen, the right action is to stay out, and the ability to watch without clicking is itself a skill worth developing. The market owes no one an entry every five minutes.
- Ignoring the spread. If your target is 5 pips and your spread is 2 pips, you need a 7-pip move just to reach your target. On pairs with spreads above 1.5 pips, tight scalping becomes mathematically hostile. Always fold the spread into your profit calculations.
- Moving your stop-loss. This habit is the single fastest route to blowing up a scalping account, because the original stop was placed for a reason, and if price reaches it the trade thesis has been invalidated. Taking the small loss and moving on to the next setup preserves both capital and composure.
- Failing to adapt to market conditions. A strategy that hums during the London open can fall apart in a low-volume afternoon. When conditions shift, your activity level should shift with them, often down to zero.
- Revenge trading after losses. After a losing trade, the impulse is to jump straight back in and “make it back.” This almost invariably leads to a worse entry, a bigger loss, and a downward spiral. Follow your daily loss limit rules.
- Neglecting to journal trades. Improvement is almost impossible without tracking, and even a bare-bones spreadsheet with the fields below will surface patterns that are invisible in the moment:
- Entry time
- Pair or instrument
- Direction (long or short)
- Result in pips and in account currency
- A brief note on your reasoning for the trade
These mistakes point to a wider truth about trading: the human side needs as much development as the technical setup, and consistency grows out of building habits as much as it grows out of refining strategies.
Frequently Asked Questions
Is scalping actually profitable for retail traders?
It can be, but it's among the most demanding trading strategies to execute consistently. The edge per trade is slim, so your discipline, execution speed, and risk management all need to be sharp. Most retail scalpers who find success spent months on demo accounts before going live.
What's the minimum account size recommended for scalping?
There's no strict minimum, but practically speaking, $1,000 to $5,000 provides enough room to size positions properly while capping risk at 0.5–1% per trade. Below $1,000, your position sizes become too small to absorb spread costs effectively on most pairs.
What's the best currency pair or market for scalping?
EUR/USD is the most popular pick for forex scalpers because of its tight spreads and deep liquidity. GBP/USD and USD/JPY are strong alternatives. For futures scalpers, the E-mini S&P 500 (ES) is the go-to instrument. What matters most is choosing instruments with consistently low spreads and high daily volume.
Do brokers and prop firms allow scalping?
Most modern brokers permit scalping, though some impose restrictions. Market makers, in particular, may enforce minimum hold times or discourage very short-duration trades because they often take the other side of your order. ECN and STP brokers, which route orders directly to liquidity providers, tend to be more scalping-friendly since they profit from commissions rather than spreads. Prop firms vary widely: some actively welcome scalpers, while others enforce specific rules around minimum trade duration and lot sizing. Always read the fine print before committing capital.
How many trades does a typical scalper take per session?
That depends on the timeframe and market conditions. On a 1-minute chart during a high-liquidity session, 20–40 trades is common. On a 5-minute chart, 5–15 trades is more typical. Quality matters far more than quantity, and experienced scalpers are comfortable with sessions of just 3–5 trades when conditions don't justify more.
Does scalping work in crypto markets?
Scalping is viable in crypto, but the challenges differ. Spreads on most crypto pairs run wider than major forex pairs, execution speed varies by exchange, and 24/7 markets mean there's no defined high-liquidity window the way forex has one. If you scalp crypto, stick to BTC/USD or ETH/USD on high-volume exchanges and budget for occasional slippage.
How much do spread and commission costs affect scalping profitability?
Considerably. Because your profit target per trade is small (5–20 pips), transaction costs eat a much larger share of each trade than they would for a swing trader. If you're paying 1.5 pips in spread plus a per-lot commission, that cost has to factor into every single setup. Many scalpers find their strategy turns unprofitable the moment they switch to a broker with wider spreads. Your choice of indicators and strategy won't compensate if your cost structure can't support tight scalping.
About the authors


Put this into practice
Brokers we have reviewed
Scored on the same five dimensions. Here are three of them — the full list is on the brokers page.



Related articles
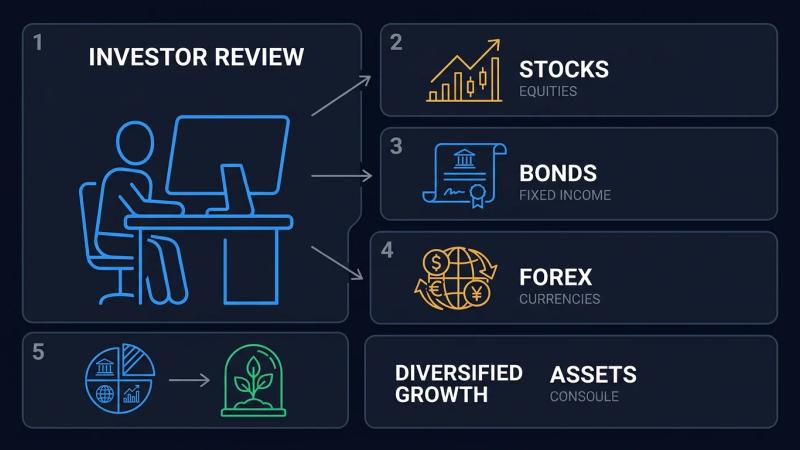
Self-Directed Brokerage Accounts: What They Are and How They Work
A plain-English guide to self-directed brokerage accounts: assets, fees, tax treatment, risk management, and the account-opening process.
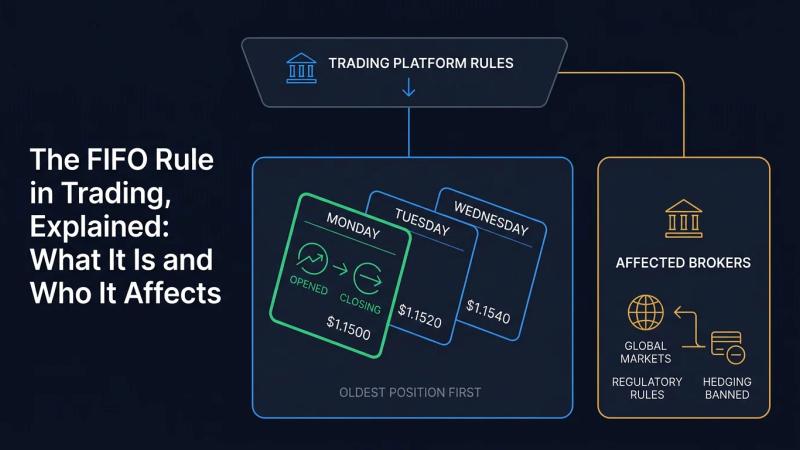
The FIFO Rule in Trading, Explained: What It Is and Who It Affects
FIFO closes your oldest open position first when you exit a trade in the same instrument. Here is how the rule works, where it applies, and how to plan around it.
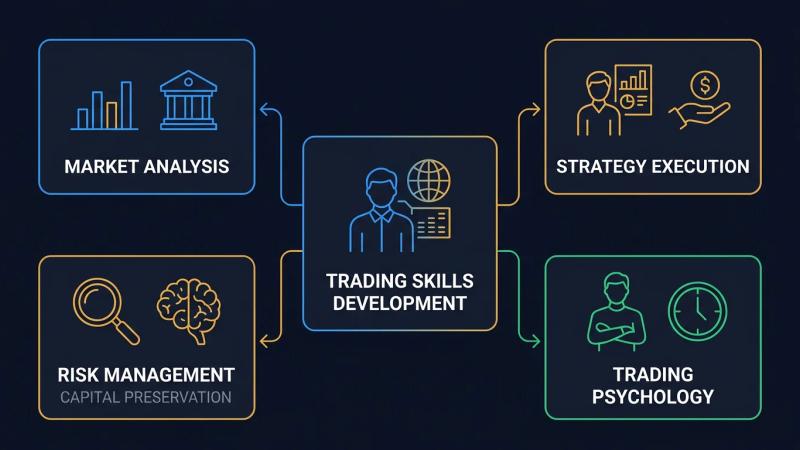
Trading Skills Development: How to Become a Better Trader
A practical guide to trading skills development: the hard skills, the soft skills, the psychological barriers, and a structured routine to build both.
0 comments