Swing Trading Complete Guide: Strategies, Timeframes, Indicators, and Screeners
You’ve stared at charts, pulled the trigger on gut-feel trades, and probably felt the sting of bailing too early or white-knuckling a position too long. That loop of impulsive entries and shaky exits is exactly what a structured swing trading approach is built to break.
This swing trading complete guide walks you through everything you need to assemble a repeatable system, from selecting the right timeframes and indicators to screening for setups and managing risk across stocks and forex. Every section feeds into the next so you leave with an operational process.
One important note before we get started: trading involves real financial risk. Past performance on any strategy or indicator does not guarantee future results. This guide is educational, not financial advice. Use it to build your own framework, test it thoroughly, and shape it around your own risk tolerance.
Let’s get into it.
What Is Swing Trading and Why Traders Choose It
Many traders fail because they never committed to a style that fits their life, their temperament, and their schedule. Swing trading occupies a sweet spot that works for a surprising number of people.
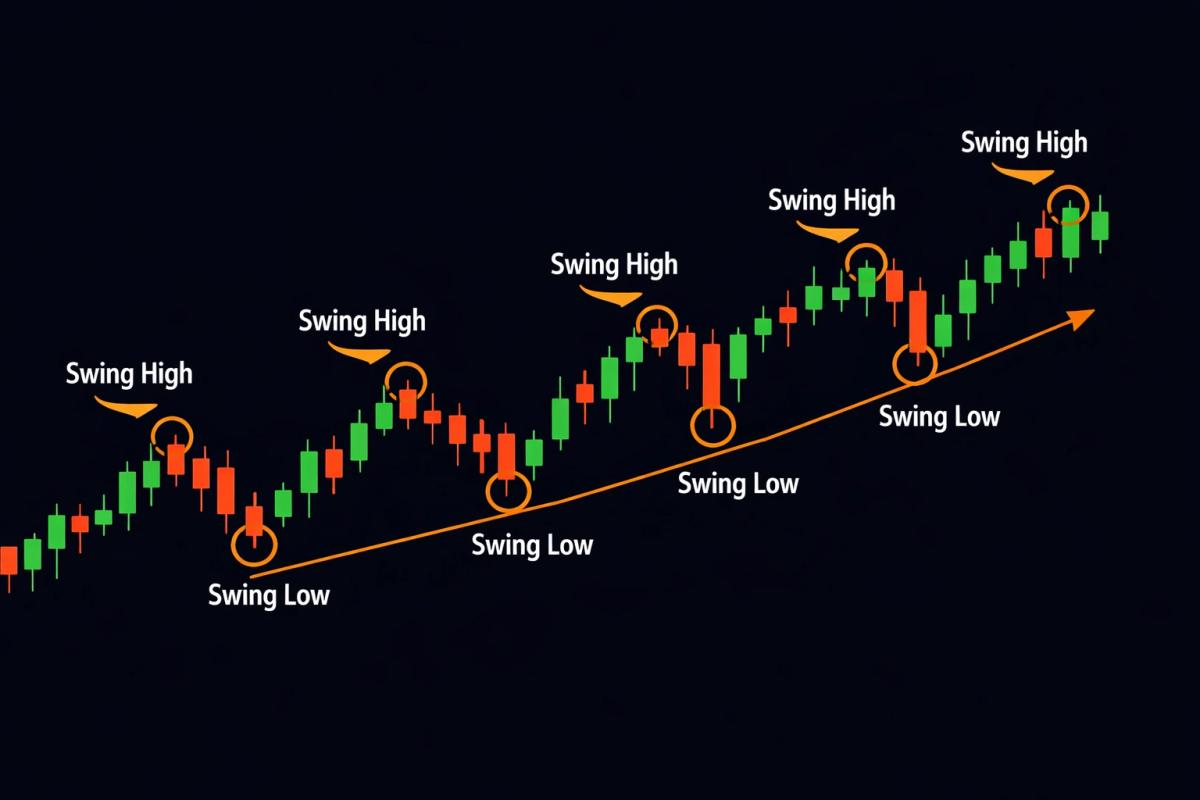
Swing trading means holding a position for roughly 2 to 14 days, aiming to capture a “swing” in price: a move from one short-term level to another. You’re not chained to your screen all day like a day trader, and you’re not parking money for months waiting for a thesis to play out. You’re hunting momentum shifts that unfold over days.
The appeal is deeply practical. You can analyze charts in the evening, place your orders, set your stops, and go about your day. That makes swing trading one of the most accessible active trading styles for people with jobs, businesses, or other commitments that don’t leave room for constant screen time.
But accessibility doesn’t mean effortless. The edge in swing trading comes from preparation, pattern recognition, and disciplined execution. Strip those away, and you’re just gambling on a slightly longer timeframe.
So what actually separates swing trading from the other major styles?
How Swing Trading Differs from Day Trading and Position Trading
The confusion between these three styles bleeds traders of time and money because they end up applying the wrong rules to the wrong timeframe.
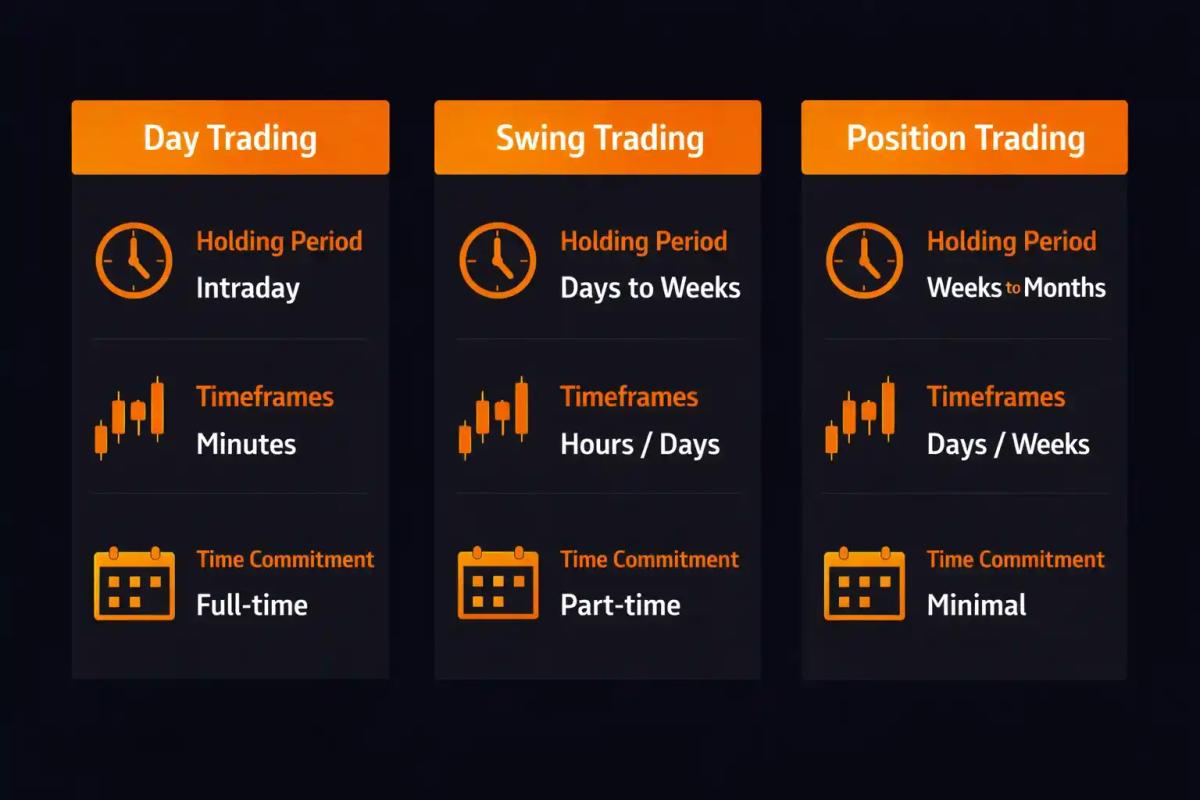
The critical difference is the type of price movement you’re targeting. Day traders hunt intraday volatility. Position traders ride macro trends. Swing traders zero in on intermediate moves: the pullbacks within trends, the breakouts from consolidation, the reversals at range extremes.
This distinction matters because the indicators, risk parameters, and entry logic all shift depending on which style you’re actually trading.
Who Swing Trading Is Best Suited For
Swing trading tends to attract a specific profile, and it’s worth honestly checking whether you fit it before investing weeks into learning strategies that may not match how you actually live.
You’re likely a good fit for swing trading if:
- You have a full-time job or other daytime commitments and can’t watch charts live all day
- You prefer making decisions based on end-of-day data rather than reacting to every tick
- You’re comfortable holding positions overnight and through short-term noise
- You want an active approach to the markets without it devouring your entire day
- You have the patience to wait for setups rather than forcing trades out of boredom
If you crave the adrenaline of rapid-fire execution, day trading is probably more your speed. If you’d rather not check on positions at all, long-term investing might suit you better. Swing trading lives in the middle, and that middle ground is where a lot of traders actually thrive.
Now that you know where swing trading fits, let’s talk about the timeframes that make it work.
Best Timeframes for Swing Trading
Choosing the wrong timeframe is like using a microscope when you need binoculars. You’ll see plenty of detail, but you’ll completely miss the bigger picture driving your trade.
The Daily Chart as the Primary Decision Timeframe
For swing trading, the daily chart is your anchor. Full stop.
Each candlestick on a daily chart represents one complete trading session, giving you enough data to identify meaningful trends, support and resistance levels, and momentum shifts without the noise that clutters lower timeframes.
When you base decisions on the daily chart, you’re working with the same data that institutional traders, fund managers, and algorithms are watching. The levels you identify (the 50-day moving average, a clear resistance zone, a trendline tested three times) carry more weight because more participants are reacting to them.
Your primary workflow should center on daily candle closes. At the end of each trading day, review your charts, assess which setups are developing, and decide your plan for the next session.
Using the 4-Hour and Weekly Charts for Confirmation
The daily chart tells you what to trade. The 4-hour and weekly charts tell you whether the context supports it.
The weekly chart gives you the big picture. Is the stock or pair in an overall uptrend, downtrend, or range? Are you approaching a major support or resistance level that’s been respected for months? You don’t want to take a bullish swing trade on the daily if the weekly shows price slamming into a ceiling that’s rejected it three times already.
The 4-hour chart helps with timing. Once the daily gives you a setup, dropping to the 4-hour can sharpen your entry. Maybe the daily shows a pullback to support, but the 4-hour reveals that momentum hasn’t shifted yet. Waiting for a 4-hour confirmation candle can improve your entry price and tighten your stop-loss distance.
Think of it as a hierarchy: the weekly sets direction, the daily identifies the trade, and the 4-hour fine-tunes execution.
Multi-Timeframe Analysis in Practice
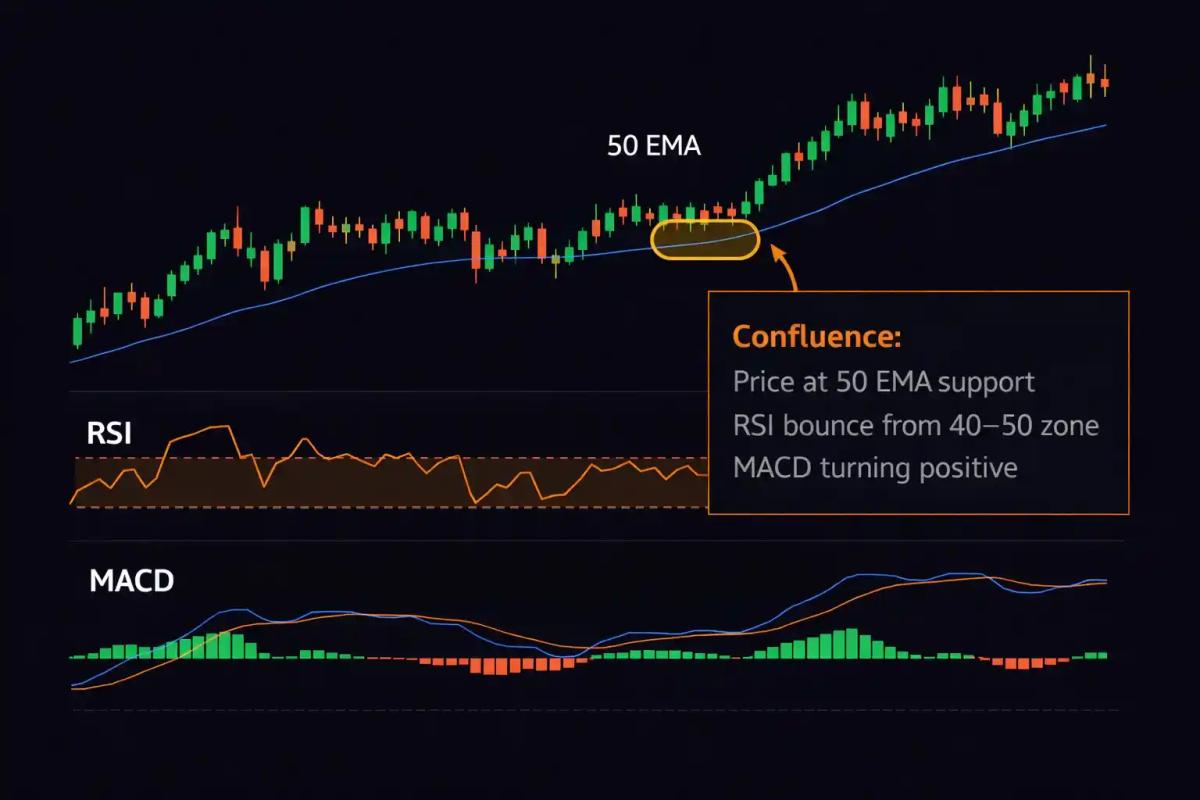
Here’s how this plays out in a real scenario. Say you’re watching a stock that’s been in a steady uptrend on the weekly chart. On the daily, you notice price has pulled back to the 50 EMA and is sitting near a horizontal support level. You switch to the 4-hour and see a bullish engulfing candle forming right at that support zone.
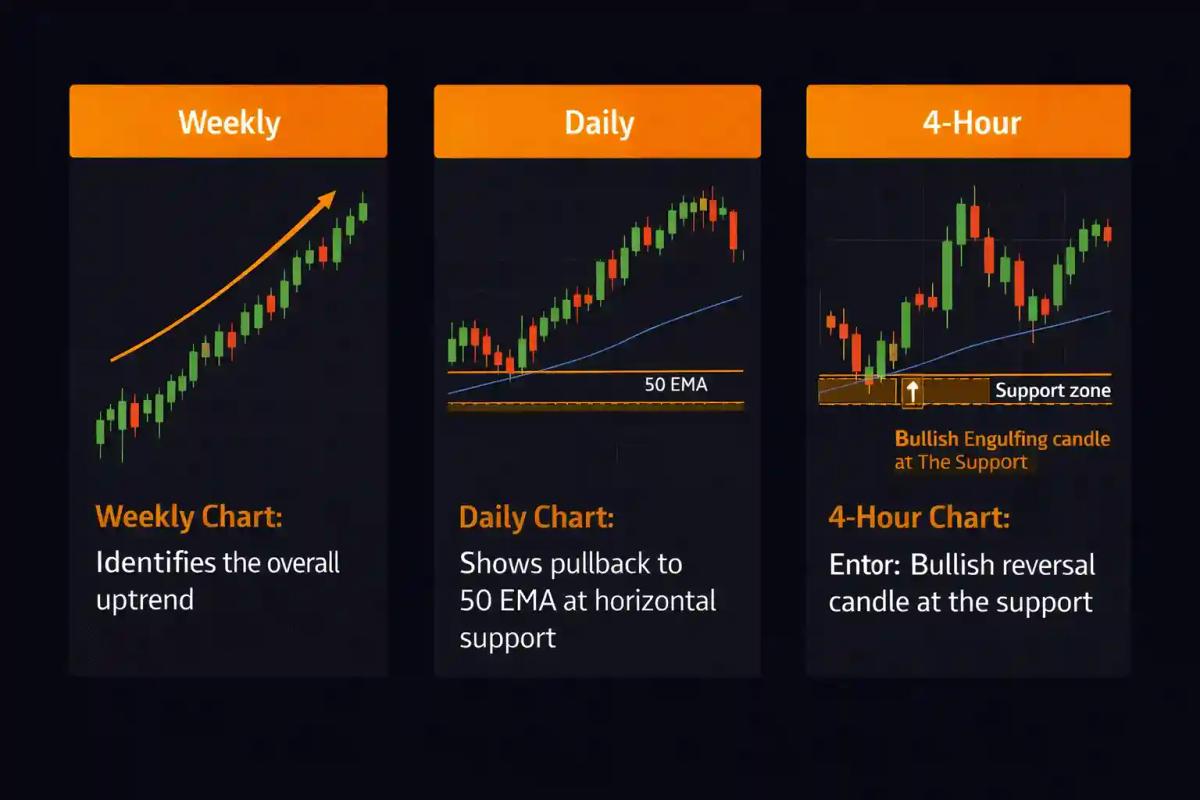
That’s multi-timeframe confluence: three timeframes all pointing in the same direction. Not every trade will line up this cleanly, but when they do, your probability of a favorable outcome increases considerably.
The mistake most beginners make is over-analyzing lower timeframes (1-hour, 15-minute) and getting shaken out of trades by noise that’s irrelevant on the daily. Stick to the three-timeframe structure, and you’ll filter out a significant number of bad signals.
With your timeframes locked in, the next question becomes: what strategies should you actually apply to them?
Swing Trading Strategies That Work
Having a strategy isn’t about finding some secret formula. It’s about establishing a clear set of rules for when to enter, where to place your stop, and when to take profit, so you’re not making emotional calls in the heat of the moment.
Here are four strategies that form the backbone of most successful swing trading approaches.
Trend Pullback Strategy
This is the bread and butter of swing trading, and for good reason. It rests on a simple truth: strong trends don’t move in straight lines. They advance, pull back, and advance again.
How it works:
- Identify a clear trend on the daily chart (higher highs and higher lows for an uptrend)
- Wait for price to pull back to a key level: a moving average (like the 20 or 50 EMA), a trendline, or a horizontal support zone
- Look for a reversal signal at that level (a bullish candlestick pattern, RSI bouncing off 40–50, or a 4-hour confirmation candle)
- Enter the trade with a stop-loss below the pullback low
- Set your take-profit at the previous swing high or use a risk-reward target of at least 1:2
The logic is clean. You’re trading in the direction of the dominant trend and entering at a discount. The pullback gives you a better price, a tighter stop, and a favorable risk-reward ratio.
The trap is entering the pullback too early, before reversal confirmation; which is why patience is non-negotiable with this strategy.
Breakout and Retest Strategy
If pullback trading is about riding the trend, breakout trading is about catching the next leg of one.
How it works:
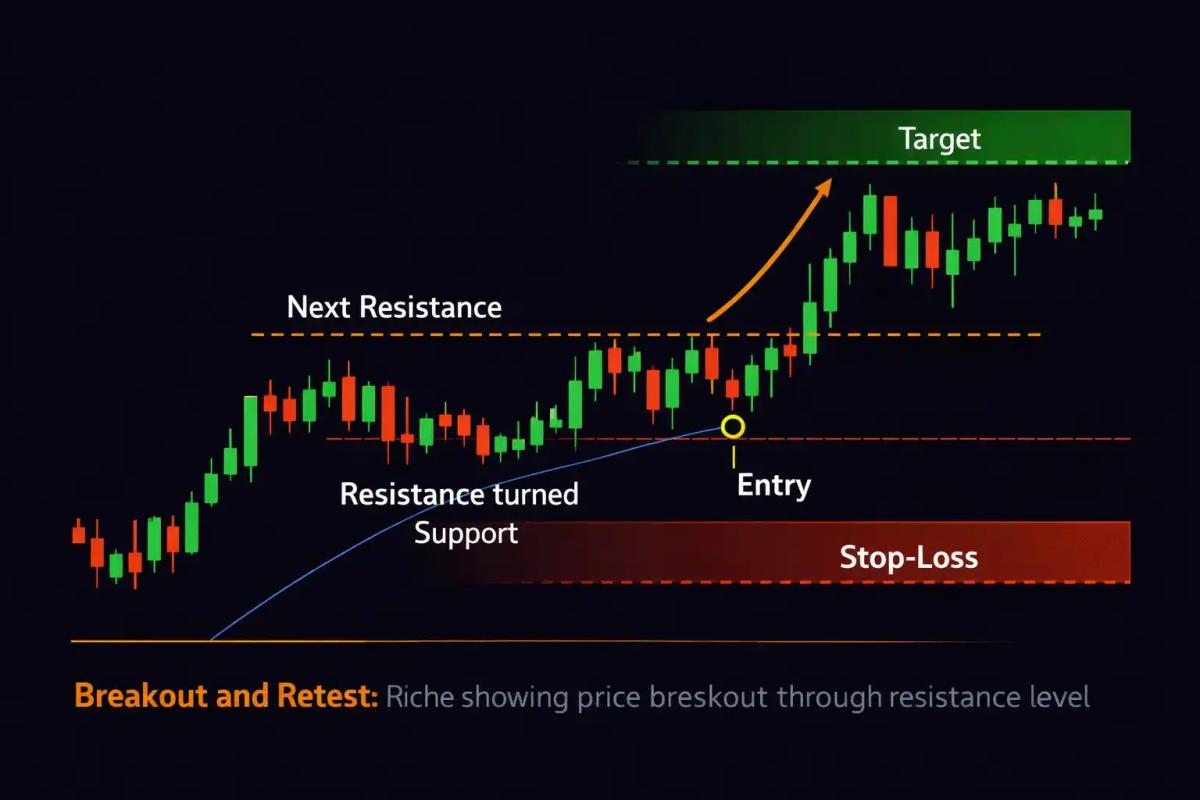
- Identify a well-defined resistance level (or support for short trades) that price has tested at least twice
- Wait for a decisive breakout candle that closes beyond the level with strong volume
- Don’t chase the breakout. Wait for the retest, where price pulls back to the broken level
- Enter when the retest holds (the old resistance acts as new support)
- Place your stop-loss below the retest low
- Target the next significant resistance level, or use the measured move (the height of the consolidation range projected from the breakout point)
The retest is critical. Many breakouts fail, and the retest filters out a large portion of the false ones. If price breaks a level and never comes back to test it, you miss the trade. That’s fine. Protecting your capital from false breakouts matters more than catching every move.
Range Reversal Strategy
Not every market trends. Sometimes price bounces between two clear levels, and that repetition creates its own set of opportunities.
How it works:
- Identify a well-defined range with clear support and resistance boundaries (at least two touches on each side)
- Wait for price to reach one of the range extremes
- Look for rejection signals at the boundary: wicks, reversal candlestick patterns, or RSI divergence
- Enter a long trade near support or a short trade near resistance
- Place your stop-loss beyond the range boundary
- Target the opposite side of the range
This strategy works best in choppy, sideways markets where trend strategies get chopped up. The key risk is that ranges eventually break, so you always need a stop in place for when the boundary fails.
A practical note: range reversals tend to work better when the range is wide enough to offer a favorable risk-reward ratio. If the range is too tight, the potential reward doesn’t justify the risk.
Moving Average Crossover Strategy
Moving average crossovers are one of the simplest swing trading signals, and that simplicity has real value when you’re building consistency.
How it works:
- Apply two exponential moving averages to your daily chart: a faster one (like the 9 or 20 EMA) and a slower one (like the 50 EMA)
- A bullish signal occurs when the faster EMA crosses above the slower EMA
- A bearish signal occurs when the faster EMA crosses below the slower EMA
- Enter on the crossover, ideally confirmed by price action or a supporting indicator
- Place your stop-loss below the recent swing low (for longs)
- Exit when the opposite crossover occurs, or at a predefined target
The strength of this strategy is its objectivity. There’s zero ambiguity about whether a crossover has happened or not. The weakness is lag: you’ll never catch the exact top or bottom. In trending markets, that lag is a small price to pay. In choppy markets, crossovers generate false signals that erode your account.
Combining the crossover with a trend filter (for example, only taking bullish crossovers when price is above the 200 EMA) helps reduce that noise considerably.
Each of these strategies leans on indicators for confirmation. So let’s look at the indicators themselves and how to use them properly.
Best Indicators for Swing Trading
The traders who use indicators well treat them as confirmation filters. The ones who struggle tend to treat them as standalone signal generators, which is a fast track to overtrading and frustration.
Relative Strength Index (RSI)
RSI measures momentum on a scale of 0 to 100 and helps you gauge whether a move is getting stretched.
For swing trading, the standard 14-period RSI works well on the daily chart. The textbook interpretation is that readings above 70 indicate overbought conditions and below 30 indicate oversold. In practice, the nuance matters more than the extremes.
In an uptrend, RSI often pulls back to the 40–50 zone during healthy corrections rather than dropping all the way to 30. If you’re looking for pullback entries in a trending market, RSI drifting toward 40–50 can signal that selling pressure is fading. Conversely, in a downtrend, rallies often stall around RSI 50–60.
RSI divergence (price making a new high while RSI makes a lower high) is particularly useful for spotting potential reversals before they fully develop. It’s a powerful early warning that momentum is weakening beneath the surface.
Moving Averages (EMA and SMA)
You’ve already seen moving averages in the strategy section, but they deserve a closer look as standalone indicators.
The EMA (Exponential Moving Average) reacts faster to recent price changes, making it more responsive. The SMA (Simple Moving Average) smooths data equally over the period, producing a more stable line.
For swing trading, key EMAs to watch include:
- 20 EMA: Tracks short-term momentum and acts as dynamic support in strong trends
- 50 EMA: The most widely watched intermediate-term average and a common pullback target
- 200 EMA/SMA: The institutional benchmark for long-term trend direction
Price’s relationship to these averages tells you a great deal. If price is above the 50 EMA and the 50 EMA is above the 200 EMA, you’re in a confirmed uptrend. That’s the environment where bullish swing trades tend to carry the highest probability.
MACD
The MACD (Moving Average Convergence Divergence) tracks the relationship between two EMAs (typically the 12 and 26 period) and plots the difference as a histogram.
For swing traders, MACD is useful in two specific ways:
- Histogram direction: When the histogram shifts from negative to positive (or vice versa), it reveals a momentum shift. This can confirm a pullback entry when it aligns with support.
- Signal line crossover: When the MACD line crosses above the signal line, it suggests bullish momentum is building. Below, bearish.
MACD’s biggest value in swing trading is confirmation, not prediction. If you see a pullback to the 50 EMA and the MACD histogram is starting to turn positive, that’s two independent pieces of evidence pointing the same direction. That’s stronger than either signal on its own.
Bollinger Bands
Bollinger Bands plot a moving average (typically 20 SMA) with upper and lower bands set at two standard deviations. They give you a visual read on volatility and potential reversal zones.
When the bands contract (squeeze together), it signals low volatility, which often precedes a significant move. When price touches or pierces the outer bands, it doesn’t automatically mean reversal, but it does mean price has traveled far from its average.
For swing trading, Bollinger Bands work well in range-bound markets. A touch of the lower band combined with RSI nearing 30 and a bullish candlestick pattern can build a solid reversal case. In trending markets, price can “ride the band” for extended periods, so band touches become less reliable as reversal cues.
How to Combine Indicators Without Overloading Your Chart
More indicators doesn’t mean better analysis. It usually means more confusion and more conflicting signals pulling you in different directions.
A practical approach is to pick one indicator from each category:
- Trend indicator: One moving average (50 EMA is a solid default)
- Momentum indicator: RSI or MACD (not both, since they measure similar things)
- Volatility indicator: Bollinger Bands or ATR (Average True Range) for stop-loss sizing
Three indicators, maximum. If they all confirm the same direction at a key level on your chart, you have confluence. If they disagree, you stay out. That straightforward framework prevents analysis paralysis and keeps your decision-making sharp.
Now let’s apply these tools to specific markets, starting with forex.
Forex Swing Trading Strategies
Forex and stocks share the same swing trading principles, but the execution details differ enough that you need to adjust your approach.
Best Currency Pairs for Swing Trading
You want pairs that trend cleanly, have enough volatility to produce meaningful swings, and offer tight enough spreads to keep costs manageable.
Strong candidates include:
- EUR/USD: High liquidity, tight spreads, and tends to form clean technical patterns
- GBP/USD: More volatile than EUR/USD, which creates wider swings and more opportunity (but also more risk)
- AUD/USD and NZD/USD: Commodity-linked pairs that often trend well during risk-on/risk-off shifts
- USD/JPY: Tends to respect technical levels and moves in defined trends
Avoid exotic pairs for swing trading unless you’re experienced with their behavior. The wide spreads and erratic price action on exotics quietly eat into your edge.
Adapting Strategies to Forex Market Characteristics
Forex trades 24 hours on weekdays, which changes how price moves compared to stocks. There are no opening gaps during the trading week (though weekend gaps do occur), and volatility clusters around session overlaps, particularly London-New York.
The pullback and breakout strategies outlined earlier translate well to forex, but keep these adjustments in mind:
- Session overlaps matter: Major moves often ignite during the London or London-New York overlap. If your daily chart setup aligns with a session overlap, the move is more likely to carry follow-through.
- News events hit harder: Central bank decisions, employment data, and inflation reports can move currency pairs hundreds of pips in minutes. Check the economic calendar before entering or holding a forex swing trade through a major release.
- Correlation awareness: Many forex pairs are correlated. If you’re long EUR/USD and long GBP/USD simultaneously, you’re essentially doubling your exposure to USD weakness. Manage your positions as a portfolio, not in isolation.
Managing Overnight and Weekend Risk in Forex
Unlike day traders, you’re holding forex positions through sessions you’re not monitoring. That means you need to account for two specific risks.
Swap costs (rollover fees): Holding a forex position overnight incurs a swap charge (or credit) based on the interest rate differential between the two currencies. Over multi-day holds, these add up. Check your broker’s swap rates before entering a trade and factor the cost into your profit calculation.
Weekend gaps: Forex markets close Friday evening and reopen Sunday evening. Events over the weekend (geopolitical developments, natural disasters, unexpected policy announcements) can cause price to gap significantly at the open. If you hold through the weekend, size conservatively and make sure your stop-loss accounts for potential gap risk.
With awareness and proper sizing, forex is a highly viable market for this style. But what about stocks? The selection process there follows its own set of rules.
Best Stocks for Swing Trading
Picking the right stock to swing trade is half the battle. The best strategy in the world won’t rescue you if you apply it to a stock that barely moves, or one that moves so erratically that no pattern holds.
What Makes a Stock Suitable for Swing Trading
When evaluating stocks for swing trades, focus on these characteristics:
- Sufficient liquidity: Look for stocks with average daily volume above 500,000 shares. Low-volume stocks carry wide bid-ask spreads and are harder to enter and exit at your intended price.
- Healthy Average True Range (ATR): ATR measures how much a stock typically moves per day. You need enough movement to generate meaningful swings. If a stock’s ATR is $0.30 at a $100 share price, that’s barely a wiggle. A stock moving 2–5% per day on average gives you room to work with.
- Clean technical structure: Some stocks respect support, resistance, and moving averages beautifully. Others chop around with no discernible pattern. Prioritize stocks that form recognizable chart patterns and react to standard technical levels.
- Catalyst potential without excessive event risk: Stocks with upcoming earnings or binary events (FDA decisions, merger votes) introduce unpredictable gaps. Swing trading around scheduled catalysts is speculative, not strategic, unless you’re experienced at managing that specific type of risk.
Sectors and Market Conditions That Favor Swing Trades
Swing trading works best in markets with clear directional bias or well-defined ranges. Broad market conditions affect your hit rate more than most traders realize.
In a trending market (the S&P 500 in a clear uptrend or downtrend), pullback strategies on individual stocks tend to perform well because the overall market tide is pushing in your favor.
In a choppy, directionless market, range strategies and breakout strategies on individual stocks that are decoupled from the broader index can still work, but your selectivity needs to increase sharply.
Sector rotation also creates swing opportunities. When capital flows into a sector (tech, energy, healthcare), stocks within that sector often make clean, tradable moves. Keeping an eye on sector ETFs can help you spot where momentum is building before drilling into individual names.
Swing Trading ETFs as an Alternative
If individual stock selection feels overwhelming at first, ETFs offer a simpler entry point for swing trading.
ETFs like SPY (S&P 500), QQQ (Nasdaq 100), or sector ETFs (XLF for financials, XLE for energy) are highly liquid, diversified within their focus area, and tend to move in technically clean patterns.
The tradeoff is that ETFs typically move less aggressively than individual stocks, so your profit targets will be smaller. But they also tend to be less prone to sudden, news-driven gaps that single stocks experience after earnings or company-specific events.
For beginners, swing trading a few liquid ETFs is a solid way to practice strategies and build confidence before moving into individual stock selection.
Now that you know what to trade and how to trade it, you need a way to find setups efficiently. That’s where screeners come in.
How to Use a Swing Trading Screener
Scanning through hundreds of stocks manually is neither practical nor efficient. A screener automates the first filter, narrowing the universe down to a manageable list of candidates that meet your criteria.
Key Screening Criteria for Swing Trade Setups
Your screener filters should align with the strategy you’re trading. Here’s a general-purpose screening framework for swing trade candidates:
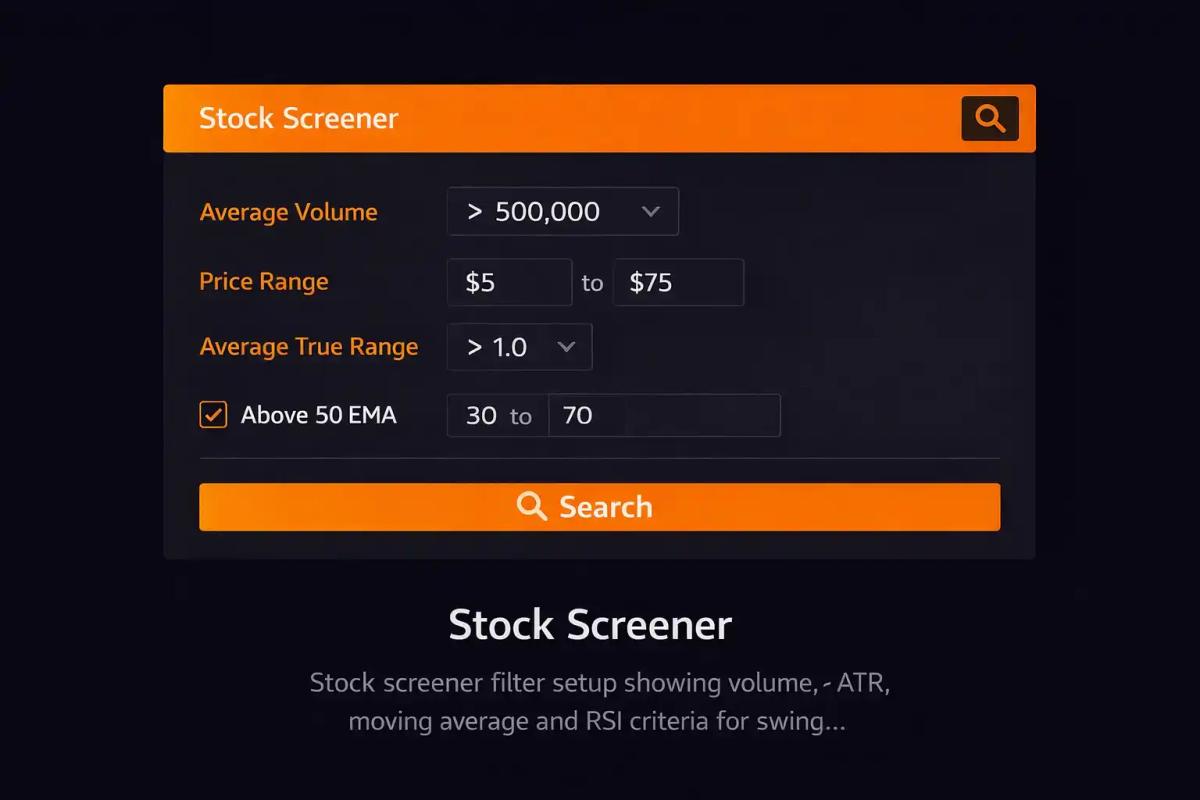
- Volume filter: Average daily volume above 500,000 (ensures liquidity)
- Price range: $10 to $200 (avoids penny stocks and very high-priced stocks that may behave differently)
- ATR filter: ATR above a minimum threshold relative to price (ensures the stock actually moves enough to be worth trading)
- Moving average filter: Price above the 50 EMA or 200 EMA (filters for stocks in uptrends, if you’re trading pullbacks)
- RSI filter: RSI between 30 and 50 (for pullback entries in uptrends) or above 50 (for breakout momentum)
- Proximity to key level: Price within a certain percentage of support, resistance, or a moving average
The specific numbers will vary based on your strategy. The point is to use the screener as a first-pass filter, not a trade signal. Screener output gives you candidates. Your chart analysis gives you the actual trade decision.
Free and Paid Screener Options
You don’t need to spend a lot of money on screening tools, especially when starting out.
Free options include platforms like TradingView (which offers robust screening with a free tier), Finviz (popular for stock screening with technical and fundamental filters), and Yahoo Finance’s screener.
Paid options like Trade Ideas, TC2000, or premium TradingView plans offer more advanced scanning criteria, real-time alerts, and backtesting capabilities. These become worth considering once your strategy is defined and you want to accelerate your workflow.
For forex, most charting platforms with screening capabilities can filter pairs by volatility, trend direction, or indicator values. Some brokers also offer built-in scanning tools within their trading platforms.
In any case, the tool matters less than the process. A simple screener used consistently outperforms a sophisticated one used sporadically.
Building a Watchlist from Screener Results
A screener gives you raw output. Your job is to turn that into a curated watchlist.
After running your scan, review each result on the chart. Ask yourself:
- Does this stock/pair have a clean technical setup that matches one of my strategies?
- Is the risk-reward ratio at least 1:2 from the current level?
- Are there any upcoming catalysts (earnings, news events) that could disrupt the setup?
- Does the broader market or sector context support this trade direction?
Your watchlist should stay small, typically 5 to 15 names at any given time. A focused list prevents scattered attention and helps you monitor your setups closely enough to act when the entry triggers.
With setups identified and strategies ready, the piece that separates consistently profitable swing traders from the rest is risk management.
Risk Management for Swing Traders
You can have the best strategy and the sharpest screener, and still lose money if your risk management is sloppy. This is the section that protects your capital when your analysis is wrong. And it will be wrong, regularly.
Setting Stop-Losses and Take-Profit Levels
Every swing trade needs a predefined stop-loss and take-profit before you enter. No exceptions.
Your stop-loss should sit at a level that invalidates your trade thesis. For a pullback entry at support, the stop goes below that support level. For a breakout retest, the stop goes below the retest low.
For take-profit, target the next significant resistance level (for longs) or use a fixed risk-reward ratio. A minimum 1:2 risk-reward ratio means that for every dollar you risk, you’re targeting at least two dollars in profit. This math ensures that even with a 40–50% win rate, you can remain profitable over time.
Resist the temptation to widen your stop-loss once you’re in a trade. If the trade hits your stop, it hit your stop. Accept the small loss, review the setup, and move on.
Position Sizing for Multi-Day Holds
Position sizing is where abstract risk percentages become concrete dollar amounts.
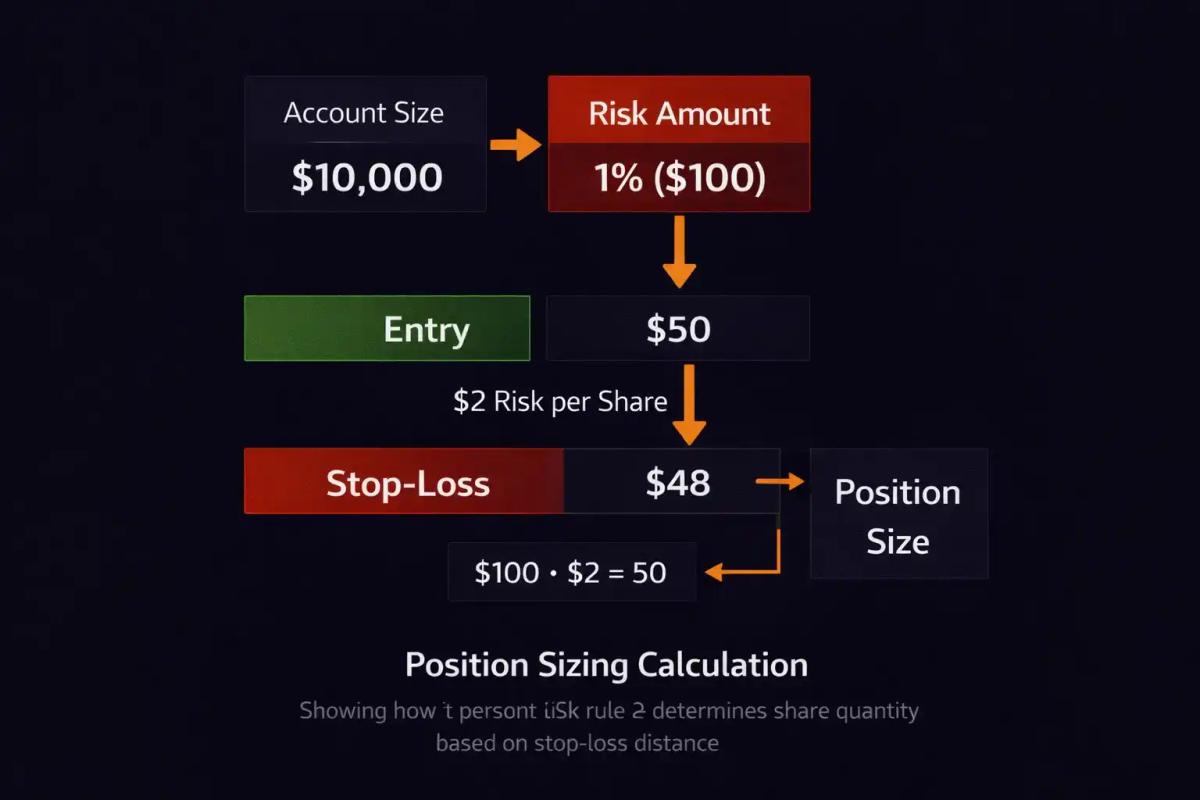
The standard guideline is to risk 1–2% of your total account on any single trade. Here’s how that translates:
If your account is $10,000 and you risk 1% per trade, your maximum loss per trade is $100. If your stop-loss is $2 below your entry, you can buy 50 shares ($100 / $2 = 50 shares).
This simple calculation keeps your losses consistent and predictable. It also means that a losing streak of five trades costs you 5–10% of your account, not 50%. That’s the difference between a setback and a catastrophe.
For forex, the same principle applies using lot sizing. Calculate the pip value of your stop-loss, determine your dollar risk, and size your lot accordingly.
Managing Drawdowns and Losing Streaks
Even a solid strategy produces losing streaks. The question is whether you’re prepared for them, both mentally and financially.
A few guidelines that help:
- Set a weekly or monthly drawdown limit. If you lose 5–6% in a week, step back and review rather than scrambling to make it back immediately.
- Reduce position size during drawdowns. If you’re in a losing streak, cut your risk per trade from 1% to 0.5% until your confidence and accuracy return.
- Don’t revenge trade. After a loss, the urge to jump right back in and “get it back” runs hot. It’s also the fastest way to compound losses. Take a break, even if it’s just 24 hours.
- Trust the sample size. A strategy’s edge reveals itself over 50–100+ trades, not 5. Don’t abandon a sound strategy after a handful of losses. Journal your trades, review them, and assess performance over meaningful sample sizes.
Risk management isn’t the exciting part of swing trading. But it’s the part that keeps you in the game long enough for your strategies to pay off.
How do you pull all of this together into a daily routine that’s actually sustainable?
Building Your Swing Trading Routine
The traders who execute consistently have a structured process they repeat daily and weekly, and it doesn’t need to consume hours of your time.
Daily and Weekly Analysis Workflow
Here’s a practical swing trading routine that fits into a busy schedule:
Weekly (30–60 minutes, typically Sunday evening):
- Review the weekly charts of major indices (S&P 500, Nasdaq) to assess overall market direction
- Run your screener to generate a fresh watchlist
- Mark key levels (support, resistance, moving averages) on each watchlist chart
- Identify which setups are closest to triggering and prioritize them
Daily (15–30 minutes, after market close or before open):
- Review the daily candle on each watchlist stock/pair
- Check if any setup has triggered or is close to triggering
- For active positions, assess whether the trade thesis is still intact
- Place or adjust orders (entries, stops, targets) as needed
- Check the economic calendar for any upcoming events that affect your positions
That’s it. The daily chart does the heavy lifting, and your routine is about reviewing, not reacting.
Trade Journaling for Swing Traders
If you’re not journaling your trades, you’re throwing away your most valuable learning tool.
For each trade, record:
- The setup and strategy used
- Entry price, stop-loss, and target
- The reason for entering (what confluence did you see?)
- The outcome (profit/loss and the risk-reward achieved)
- A screenshot of the chart at entry and exit
- What you’d do differently next time
After 20–30 trades, patterns emerge. You might discover that your breakout trades have a noticeably lower win rate than your pullback trades, or that you consistently exit too early and leave profit on the table. That data is gold. Without a journal, it stays invisible.
When to Sit Out and Protect Capital
One of the most underrated skills in swing trading is knowing when not to trade.
If the market is choppy with no clear direction, your strategies will produce more false signals. If you’re going through a rough personal stretch and your focus is compromised, your execution quality drops. If you’ve hit your drawdown limit for the week, forcing more trades won’t fix the problem.
Sitting out is a deliberate decision to protect capital during periods when your edge is diminished. The market will be there next week. Your capital might not be if you trade through unfavorable conditions.
Before we wrap up the operational sections, let’s flag the mistakes that trip up most swing traders so you can sidestep them.
Common Swing Trading Mistakes to Avoid
Knowing what not to do is sometimes more valuable than knowing what to do. These are the pitfalls that consistently derail swing traders at every experience level.
- Overtrading: Taking setups that don’t fully meet your criteria because you’re bored or feel like you “should” be in a trade. Quality over quantity, always.
- Ignoring the broader market context: Taking bullish swing trades during a broad selloff, or shorting aggressively during a strong rally.
- Moving stop-losses to avoid taking a loss: This turns small, manageable losses into large, damaging ones.
- Using too many indicators: If your chart looks like a modern art painting, you’ve gone overboard. Simplify. Confluence from two to three tools is enough.
- Chasing entries: If you missed the entry, you missed it. Chasing price after it’s already moved away from your planned level wrecks your risk-reward ratio and puts you on the back foot from the start.
- Not having a written trading plan: If your rules exist only in your head, they’ll bend every time emotions get involved. Write them down. Review them before every session.
- Skipping the journal: Without data on your own performance, improvement becomes guesswork. You’re just hoping you’ll figure out what works.
- Trading too large during winning streaks: Confidence is earned, but inflating your position size after a few wins sets you up for an outsized loss when the streak ends. And it will end.
Every experienced swing trader has made most of these mistakes at some point. The goal is recognizing the pattern quickly and correcting course before it costs real money.
Frequently Asked Questions
How much capital do I need to start swing trading?
There’s no universal minimum, but for stocks, $2,000 to $5,000 gives you enough room to take properly sized positions with meaningful risk management. For forex, many brokers allow you to start with as little as $100 to $500 using leverage, though starting with more gives you greater flexibility. The key is that your position sizing makes sense relative to your account.
Can I swing trade while working a full-time job?
Yes, and this is one of the main reasons people gravitate toward swing trading. Since your primary analysis is based on daily chart closes, you can review charts in the evening, place your orders, and leave them alone during the day. Most swing traders spend 30 minutes to an hour per day on analysis and trade management, which fits comfortably around a standard work schedule.
Is swing trading actually profitable?
Swing trading can be profitable, but it’s neither guaranteed nor automatic. Profitability depends on your strategy’s edge, your risk management discipline, and your ability to execute consistently over time. Many swing traders are profitable, and many are not. The difference usually comes down to whether they follow a structured approach with patience, rather than which specific strategy they chose.
How many trades should I expect to take per week?
This varies by strategy and market conditions, but most swing traders take somewhere between 2 and 6 trades per week. Some weeks you might take none if no quality setups appear, and that’s perfectly fine. Forcing trades to meet some arbitrary activity quota is a common way to erode your edge. Let the setups come to you.
Does swing trading work better for stocks or forex?
Both markets work well for swing trading, and the core strategies are largely the same. Stocks offer more individual names to choose from and can produce larger percentage moves. Forex offers higher leverage, 24-hour trading during the week, and very tight spreads on major pairs. Many swing traders eventually trade both. Start with whichever market you’re more comfortable with, and expand once your process is solid.
What’s the best time of day to analyze swing trades?
Since swing trading relies primarily on the daily chart, the best time to analyze is after the daily candle closes, which in the US is after 4:00 PM Eastern for stocks. For forex, the daily close is typically at 5:00 PM Eastern. Analyzing after the close gives you a complete picture of the day’s price action without the distraction of live price movement pulling at your decisions.
Is swing trading suitable for complete beginners?
Swing trading is more approachable than day trading for beginners because it doesn’t require constant screen time or split-second decisions. That said, you still need a foundational understanding of chart reading, support and resistance, and basic indicators before jumping in with real money. If you can read candlestick charts, understand moving averages, and grasp the concept of risk-reward ratios, you have enough base knowledge to start learning swing trading on a demo account before risking actual capital.
About the authors


Related articles
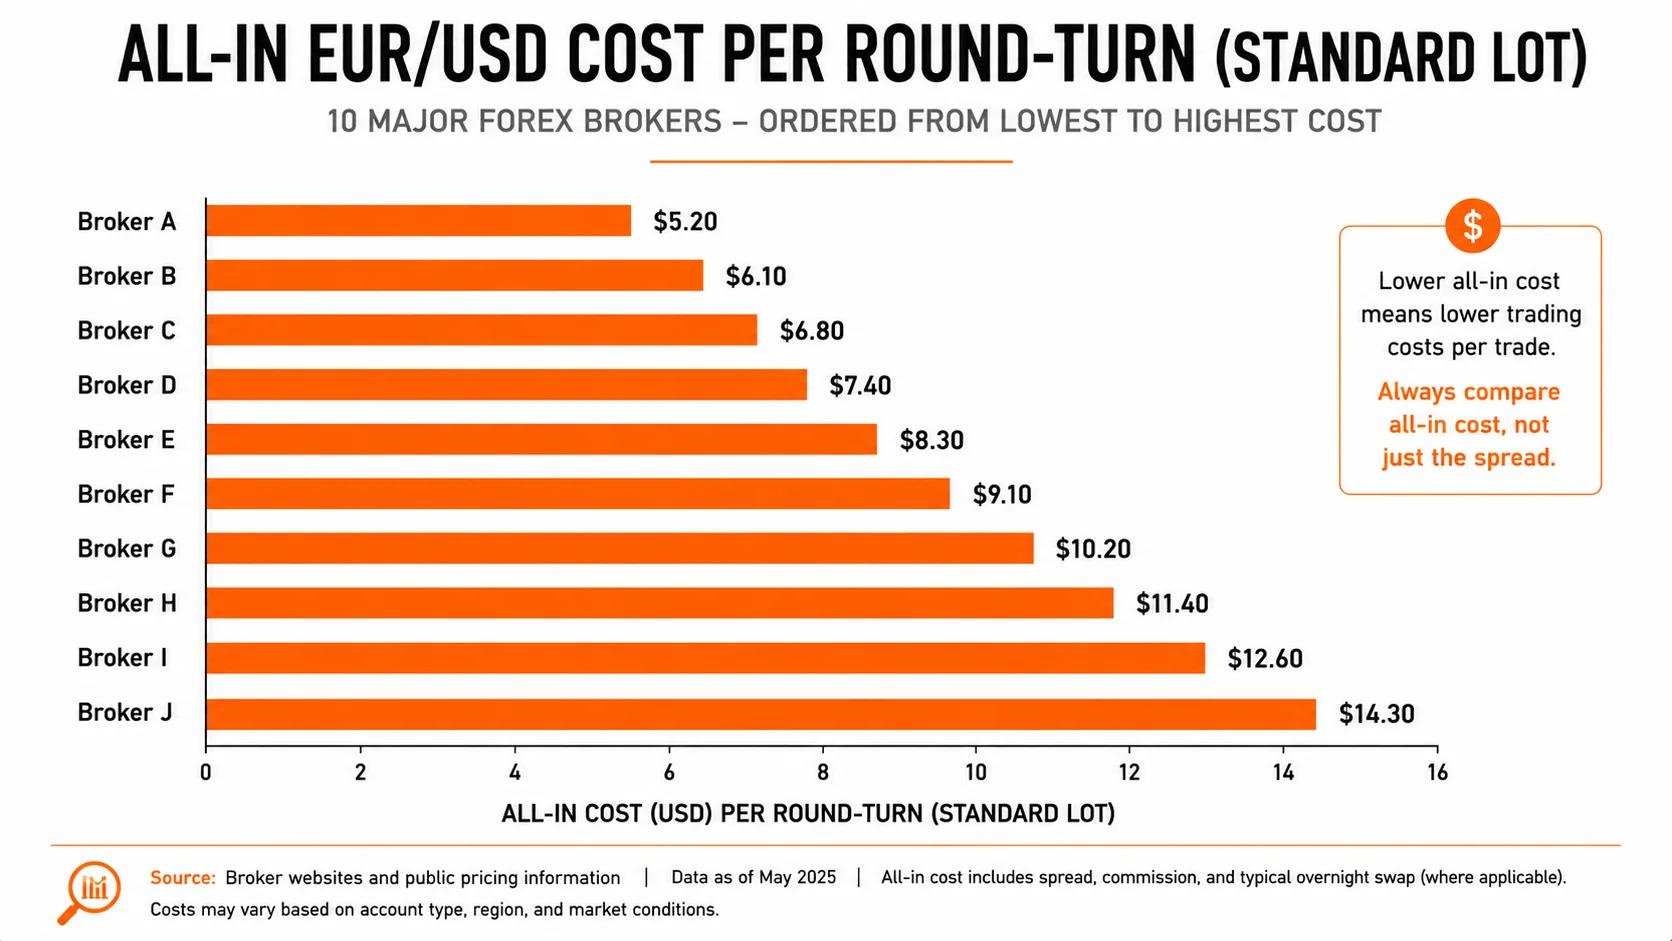
The True Cost of Trading: A Data-Driven Comparison Across 10 Forex Brokers
Full-cost comparison across spreads, commissions, swap rates, and fees for 10 major forex brokers; including EUR/USD, GBP/USD, and Gold trading costs per lot.

7 Moments to Be Bullish on Gold (When to Buy Gold and Why It Matters)
Discover 7 key moments that signal when to buy gold, from real rate shifts to dollar weakness and central bank demand.
Copy Trading Explained: How It Works and How It Compares to Social Trading
Copy trading explained: learn how copy trading works, how it compares to social trading, and which model fits your goals. Real risks and honest trade-offs.
0 comments