Technical Analysis
6 articles in this category.
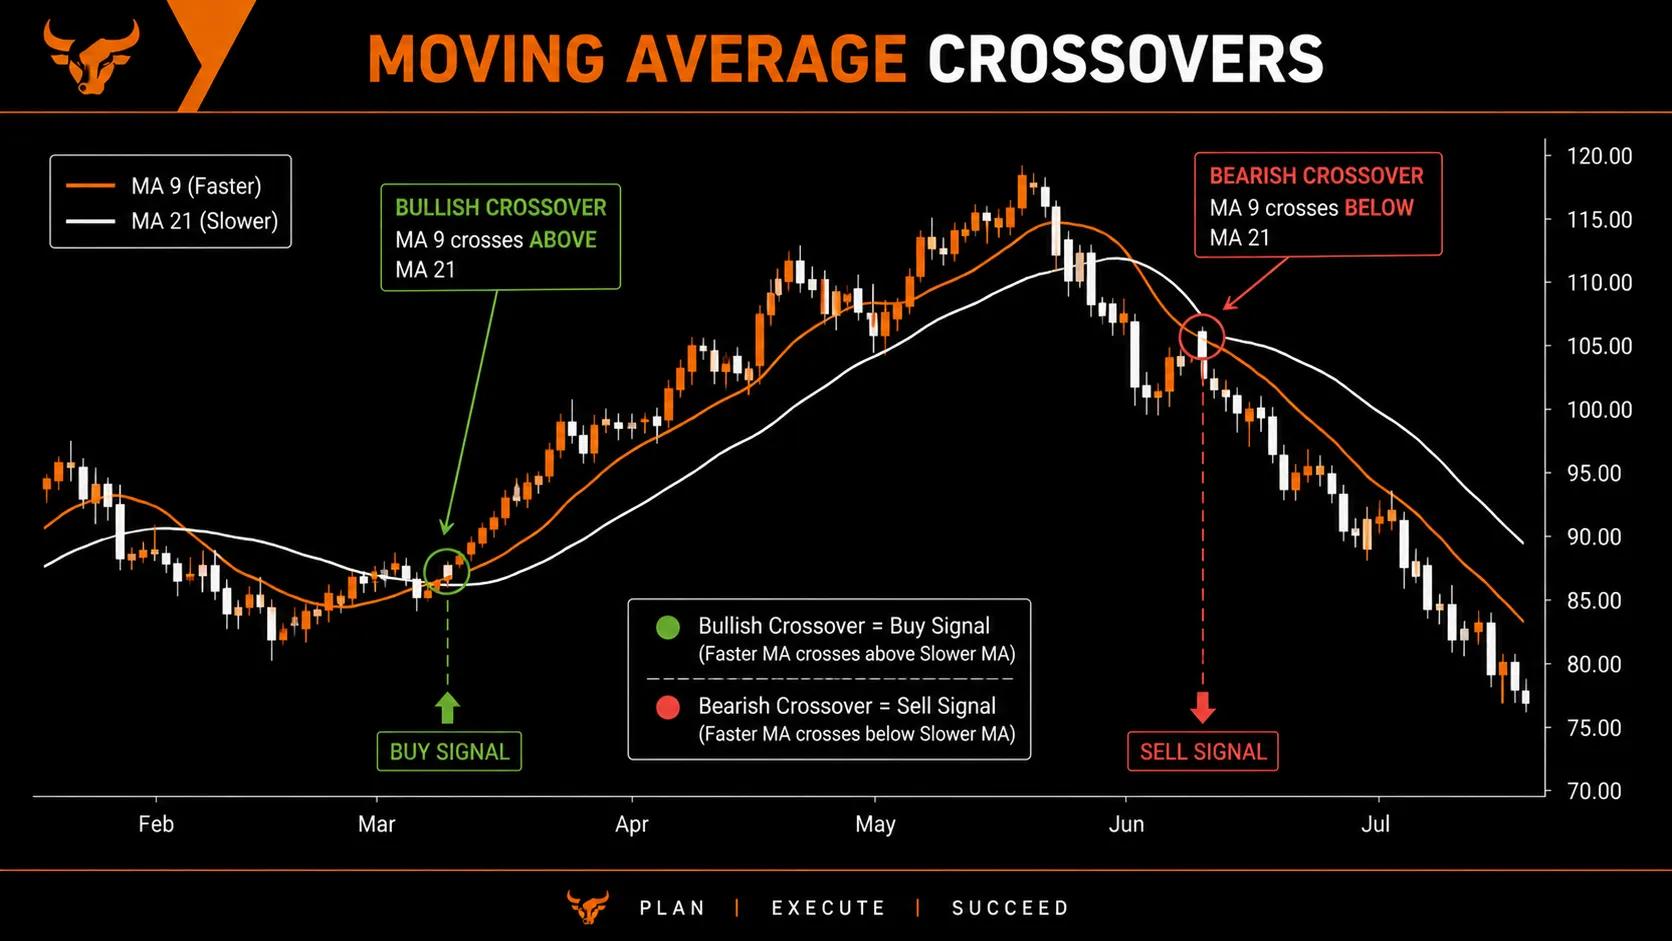
Moving Averages Explained: SMA, EMA, and How Traders Use Them
Moving average trading explained simply. Learn how SMA and EMA work, how to read crossovers, and how traders use them to spot trends and time entries.
 Intermediate
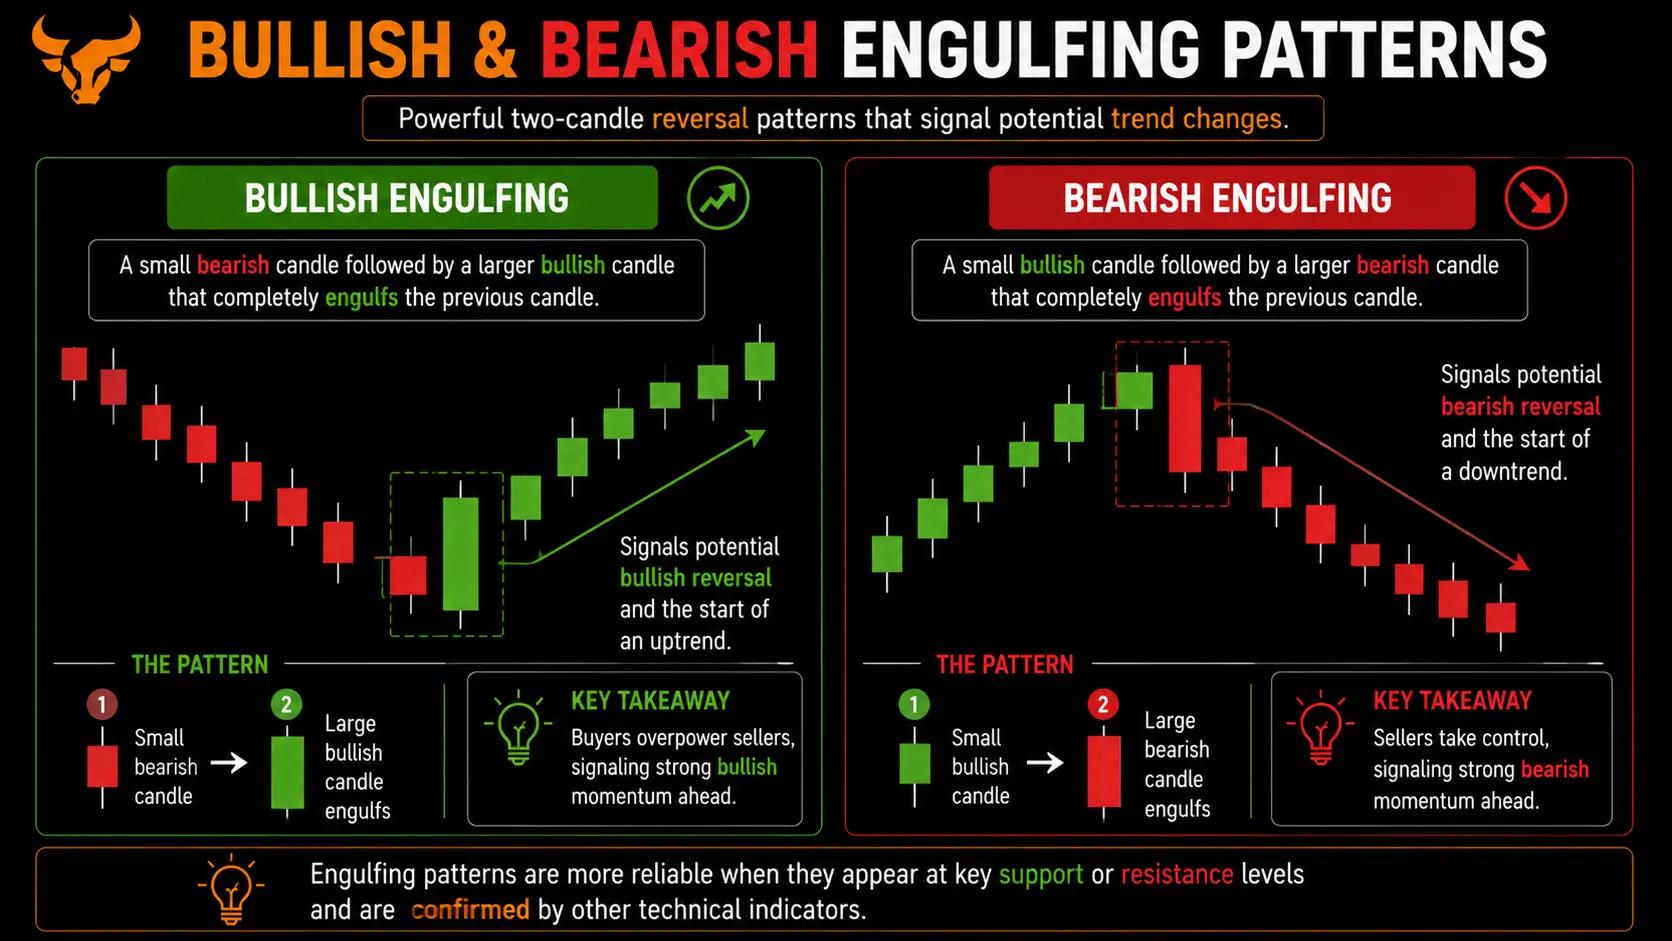
Candlestick Patterns Explained: A Practical Visual Guide
Candlestick patterns explained for new traders: read doji, hammer, and engulfing signals with clear visual chart examples.

Demo to Live Trading Guide: How to Make the Switch Without Blowing Up
Learn how to move from demo to live trading without blowing up. Covers mindset, position sizing, and your first week live.
 Beginner
RSI Indicator Explained: How to Read and Trade the Relative Strength Index
A practical, citable guide to the RSI indicator: formula, thresholds, divergences, failure swings, false signals, and how to tune the period for your trading style.
 Beginner
Support and Resistance Trading: How to Identify and Trade Price Levels
A practical guide to support and resistance trading: how to mark levels, filter false breakouts, size positions, and apply the strategy across asset classes.
 Beginner
Technical Analysis Explained: Charts, Patterns, and Trading Tools
A working guide to technical analysis for retail traders: chart types, indicators, limitations, backtesting and risk management framed around real broker execution.