


Technical Analysis · Intermediate · 3 min read
Moving Average Crossover Strategy: Golden Cross, Death Cross, and False Signals
The mechanics of a crossover signal
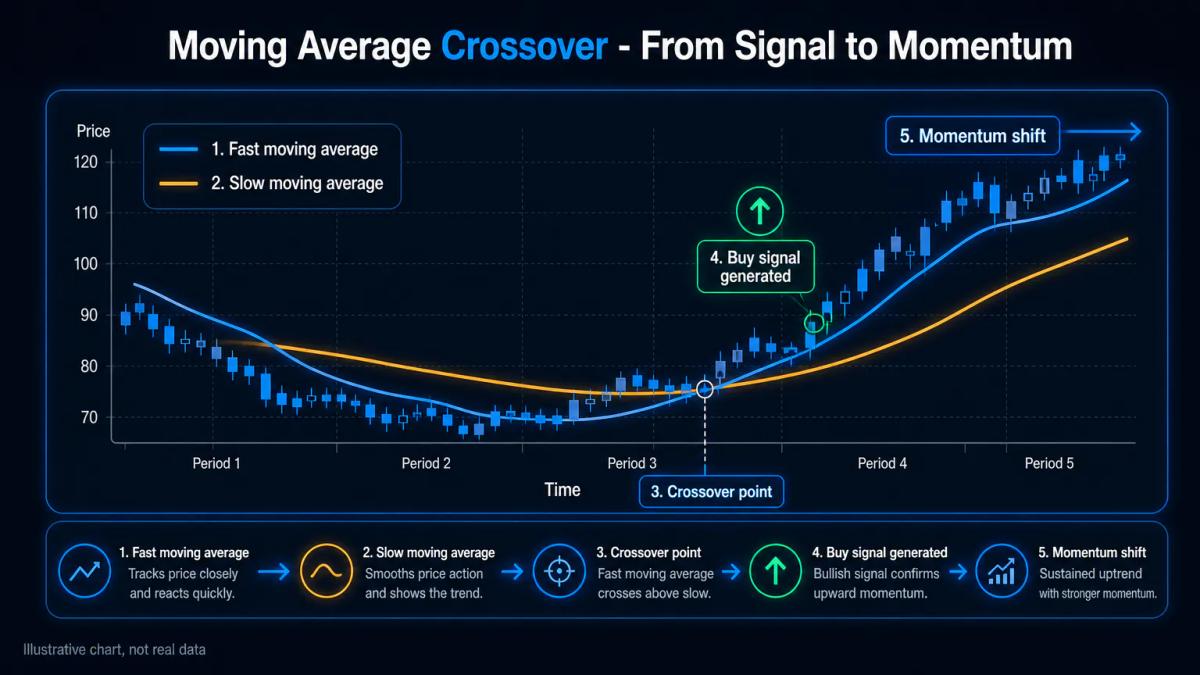
A moving average crossover happens when a faster moving average crosses above or below a slower one, generating a buy or sell signal.
A moving average is the mean of the closing price over a set number of bars. The fast line reacts quickly to recent prices, while the slow line smooths the longer trend. When the two lines intersect, momentum has shifted enough that recent prices are pulling the average through the longer one.
Putting this into practice means opening an account: start with the best forex brokers our team reviewed.
Golden cross and death cross patterns
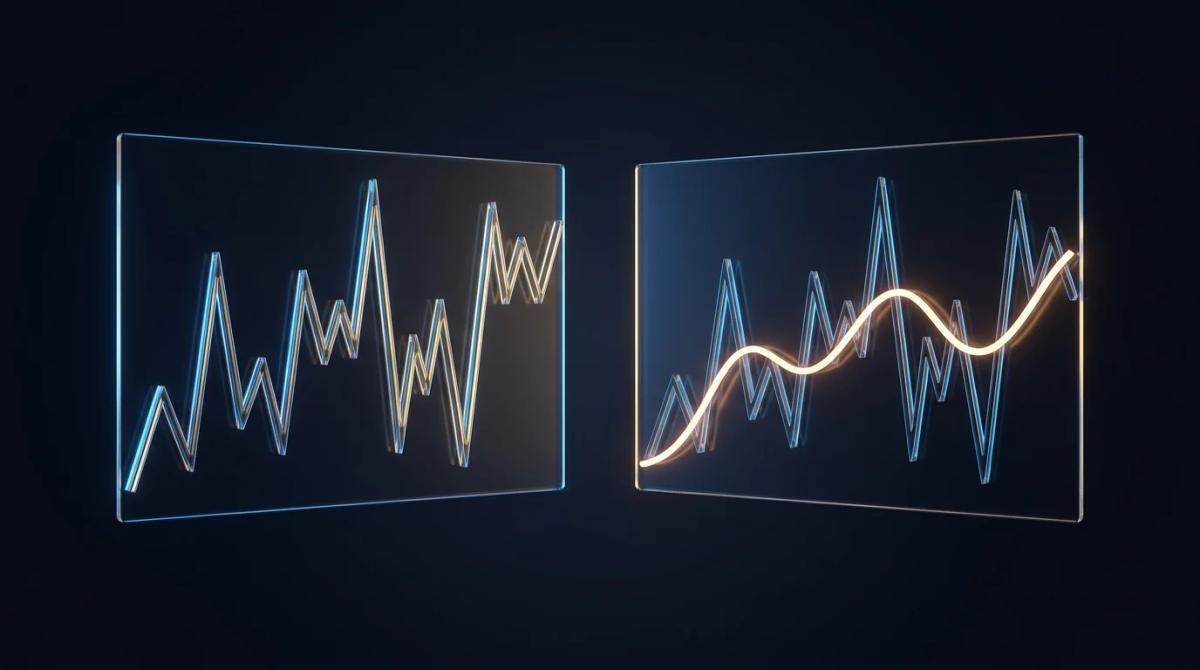
The golden cross is a bullish crossover where a shorter period moving average crosses above a longer one, classically the 50 day above the 200 day on a daily chart.
The death cross is the mirror image: the 50 day falls below the 200 day, flagging bearish pressure.
Both use long lookbacks, so they lag the actual turn and are treated as regime signals for position trading rather than precise entries. Shorter combinations, such as 9 and 21 exponential moving averages, produce faster crosses for swing trading.
Why timeframe and period selection matter
The periods you pick decide the trade-off between speed and noise.
- A 5 and 20 combination on a 15 minute chart fires often and catches small moves, but many crosses reverse within a few bars.
- A 50 and 200 combination on the daily chart fires rarely and lags the low, yet each signal tends to align with a durable trend.
Match the pair to your holding period: intraday traders lean on exponential averages under 30 periods, swing traders use 20 to 50, position traders keep the 50 and 200. Understanding how forex trading works helps you apply these timeframes to currency pairs.
Trading the crossover in practice
A common playbook enters long on the bar that closes after the fast line crosses above the slow line, and exits or reverses on the opposite cross.
- Place your initial stop loss (the price at which the trade is closed to cap the loss) below the slow moving average or the most recent swing low, whichever is further.
- Size the position so that the distance from entry to stop equals a fixed fraction of account equity, typically under 1%.
- Confirmation from rising volume, an RSI above 50, or a positive MACD histogram filters weaker crosses.
False signals and ranging markets
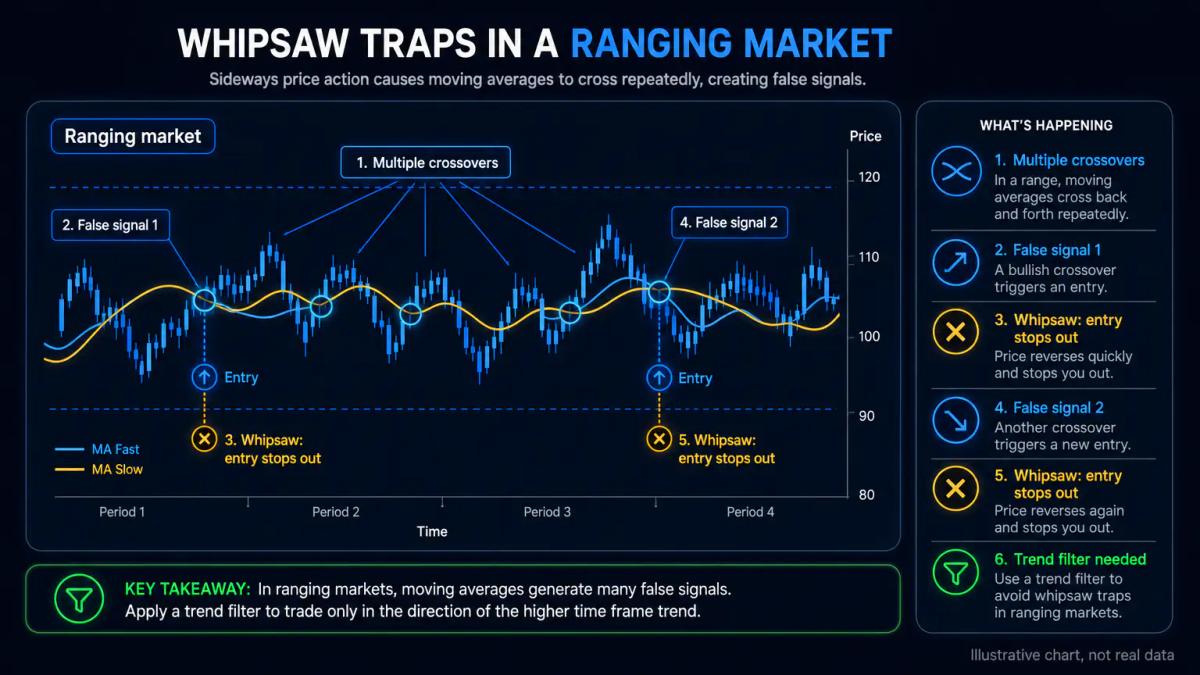
In sideways price action the two averages hug each other and cross repeatedly, producing whipsaws where each entry stops out before a trend forms.
A trend filter cuts most of these: require the 200 period average to slope upward before taking longs, or demand that ADX, a strength gauge, reads above 20. Backtesting the same crossover pair across forex vs stocks trading pairs like EURUSD and ranging pairs like EURGBP shows the edge lives almost entirely in trending conditions, which is why regime detection matters more than the specific periods chosen.
FCA: UK retail clients trading CFDs face maximum leverage of 30:1 on major forex pairs and 20:1 on major indices, which caps the position size available for crossover strategies on margin.
Frequently Asked Questions
What are moving averages and how do they work?
A moving average is the average closing price over a set number of bars, recalculated as each new bar closes. Simple moving averages weight every bar equally; exponential moving averages give more weight to recent bars, so they turn faster when price shifts.
What is the difference between a golden cross and a death cross?
A golden cross is a bullish signal where a shorter period moving average crosses above a longer one, classically the 50 day over the 200 day. A death cross is the bearish opposite: the shorter average drops below the longer, flagging downside pressure and a possible trend change.
How do I choose the right moving average periods for my trading style?
Align the periods with your holding time. Intraday traders often use exponential averages between 5 and 30 bars; swing traders use 20 to 50; position traders stick to 50 and 200 on the daily chart. Test each pair on the instrument and timeframe you actually trade before committing capital.
Can I use moving average crossovers as my only trading signal?
You can, but the edge is thin without filters. Crossovers whipsaw in ranging markets and lag turning points in fast trends. Adding a trend strength filter such as ADX, a momentum check like RSI, or a volume condition reduces false entries and improves the win rate meaningfully.
About the authors


Related articles
Moving Averages Explained: SMA, EMA, and How Traders Use Them
Moving average trading explained simply. Learn how SMA and EMA work, how to read crossovers, and how traders use them to spot trends and time entries.
Candlestick Patterns Explained: A Practical Visual Guide
Candlestick patterns explained for new traders: read doji, hammer, and engulfing signals with clear visual chart examples.

ATR indicator explained: measuring volatility and setting stops
A practical guide to the ATR indicator: calculation, stop loss placement, position sizing, limitations in ranging markets, and behaviour across asset classes.
0 comments