


Quantitative trading is a method of trading financial markets that relies on mathematical models, statistical analysis, and large datasets to identify opportunities and drive decisions. Rather than reading charts by feel or reacting to headlines, quant traders build structured frameworks to find edges in the market, then test those frameworks rigorously before putting real capital at risk.
This article breaks down what quantitative trading actually involves, how it differs from algorithmic trading in ways that matter, the core strategies quant traders use, and whether it’s realistically accessible to retail traders like you. Nothing here is financial advice. It’s an educational walkthrough designed to give you a clear mental model you can build on.
What Is Quantitative Trading?
Quantitative trading is the application of math and data science to financial markets. If discretionary trading is an art, quant trading sits closer to engineering. You’re building models, testing hypotheses, and letting data reveal where statistical edges might exist.
That said, emotion isn’t completely removed from the picture. Humans still design the models, choose the data, and decide which assumptions to build on. The difference is that the decision-making process is systematic rather than intuitive.
Core Components of a Quantitative Approach
Every quantitative trading approach shares a few foundational elements, regardless of the specific strategy or asset class:
- Data as the raw material. Quant trading starts with data, and lots of it. Price history, volume, volatility, economic indicators, order flow, even alternative data like satellite imagery or sentiment scores. The quality and depth of your data define the ceiling of your models.
- Mathematical and statistical models. These are the engines. Models translate raw data into actionable signals, whether through regression analysis, probability distributions, time-series analysis, or machine learning techniques that detect patterns the human eye can’t easily spot.
- Hypothesis-driven process. Quant traders don’t just mine data and hope something sticks. They start with a thesis (for example, “stocks that drop sharply on low volume tend to bounce within five days”), then test it rigorously against historical data.
- Backtesting as validation. Before a model goes live, it gets tested against historical market conditions. This step is non-negotiable. Without backtesting, you’re guessing with a veneer of math on top.
- Risk management frameworks. Models quantify not just opportunity but risk. Position sizing, drawdown limits, and exposure controls are built into the system, not bolted on as afterthoughts.
Think of it like building a bridge. You measure, model the load, simulate stress conditions, and only then begin construction. Quant trading follows that same logic, applied to markets.
Who Uses Quantitative Trading (Institutional and Retail)
Historically, quantitative trading has been the domain of hedge funds, investment banks, and proprietary trading firms. Names like Renaissance Technologies and Two Sigma are practically synonymous with the quant world, operating with teams of PhDs, massive datasets, and computing power that most individuals simply can’t match.
But the landscape is shifting. Retail traders now have access to programming languages like Python and R, free historical data sources, and cloud computing at a fraction of what it cost a decade ago. You won’t replicate a Renaissance-level operation from your laptop, but you can absolutely apply quantitative methods to your own trading at a smaller scale.
So if quant trading is data-driven and model-based, where exactly does algorithmic trading fit in? And why do so many people treat them as interchangeable?
Quantitative Trading vs Algorithmic Trading: The Real Difference
The terms “quantitative trading” and “algorithmic trading” get swapped so often that even experienced traders blur the line. They’re not the same thing, though, and understanding the distinction reshapes how you think about both.
Where They Overlap
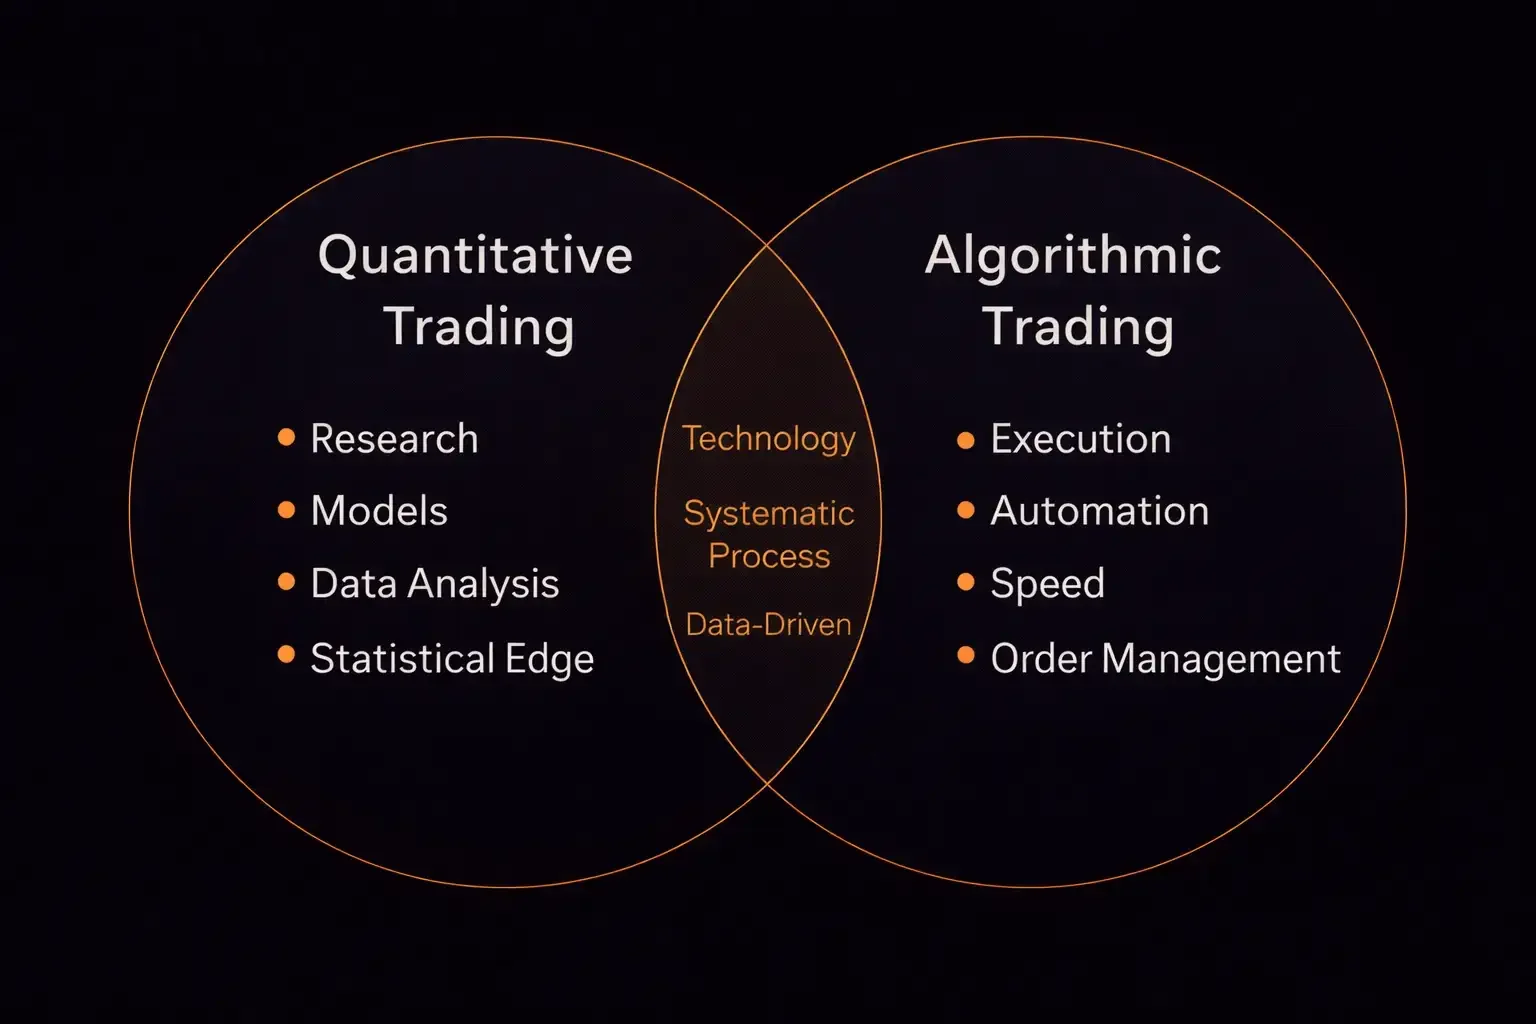
There is genuine overlap, which explains the confusion. Both approaches can involve:
- Automated execution of trades
- Use of technology and programming
- Data-driven decision frameworks
- Systematic (non-discretionary) processes
Many quant strategies are executed algorithmically, and many algorithms are built on quantitative research. In practice, they frequently coexist inside the same system.
Where They Diverge
The critical difference lies in what each term emphasizes.
Quantitative trading is about the research and model-building process. It’s the “why” behind a trade. Why does this opportunity exist? What statistical evidence supports it? What’s the expected edge, and how confident are we in it? Quant trading lives in the world of hypothesis testing, data analysis, and model validation.
Algorithmic trading is about the execution mechanism. It’s the “how.” How does the trade get placed? How fast? Under what conditions? Algo trading is fundamentally about automating the act of trading, whether to reduce human error, increase speed, or handle complex order routing.
Here’s a useful way to picture it: quantitative trading is like designing a recipe based on food science, testing ingredient ratios, and optimizing for flavor profiles. Algorithmic trading is the automated kitchen that cooks that recipe at scale without a chef standing over the stove.
You can have quant trading without algorithms (a trader manually executing signals from a statistical model). And you can have algorithmic trading without quant research (a simple bot that buys every time price crosses a moving average, with no deeper statistical analysis behind it).
Quick Comparison Summary
Aspect | Quantitative Trading | Algorithmic Trading |
Primary focus | Research, modeling, finding edge | Execution, automation, speed |
Core question | “Why should this trade work?” | “How should this trade be placed?” |
Key skills | Statistics, math, data science | Programming, systems engineering |
Can exist without the other? | Yes (manual execution of quant signals) | Yes (automating simple rules without deep research) |
Typical output | Trading models and strategies | Execution systems and order management |
With that distinction squared away, let’s look at what the quantitative trading process actually looks like from start to finish.
How Quantitative Trading Works in Practice
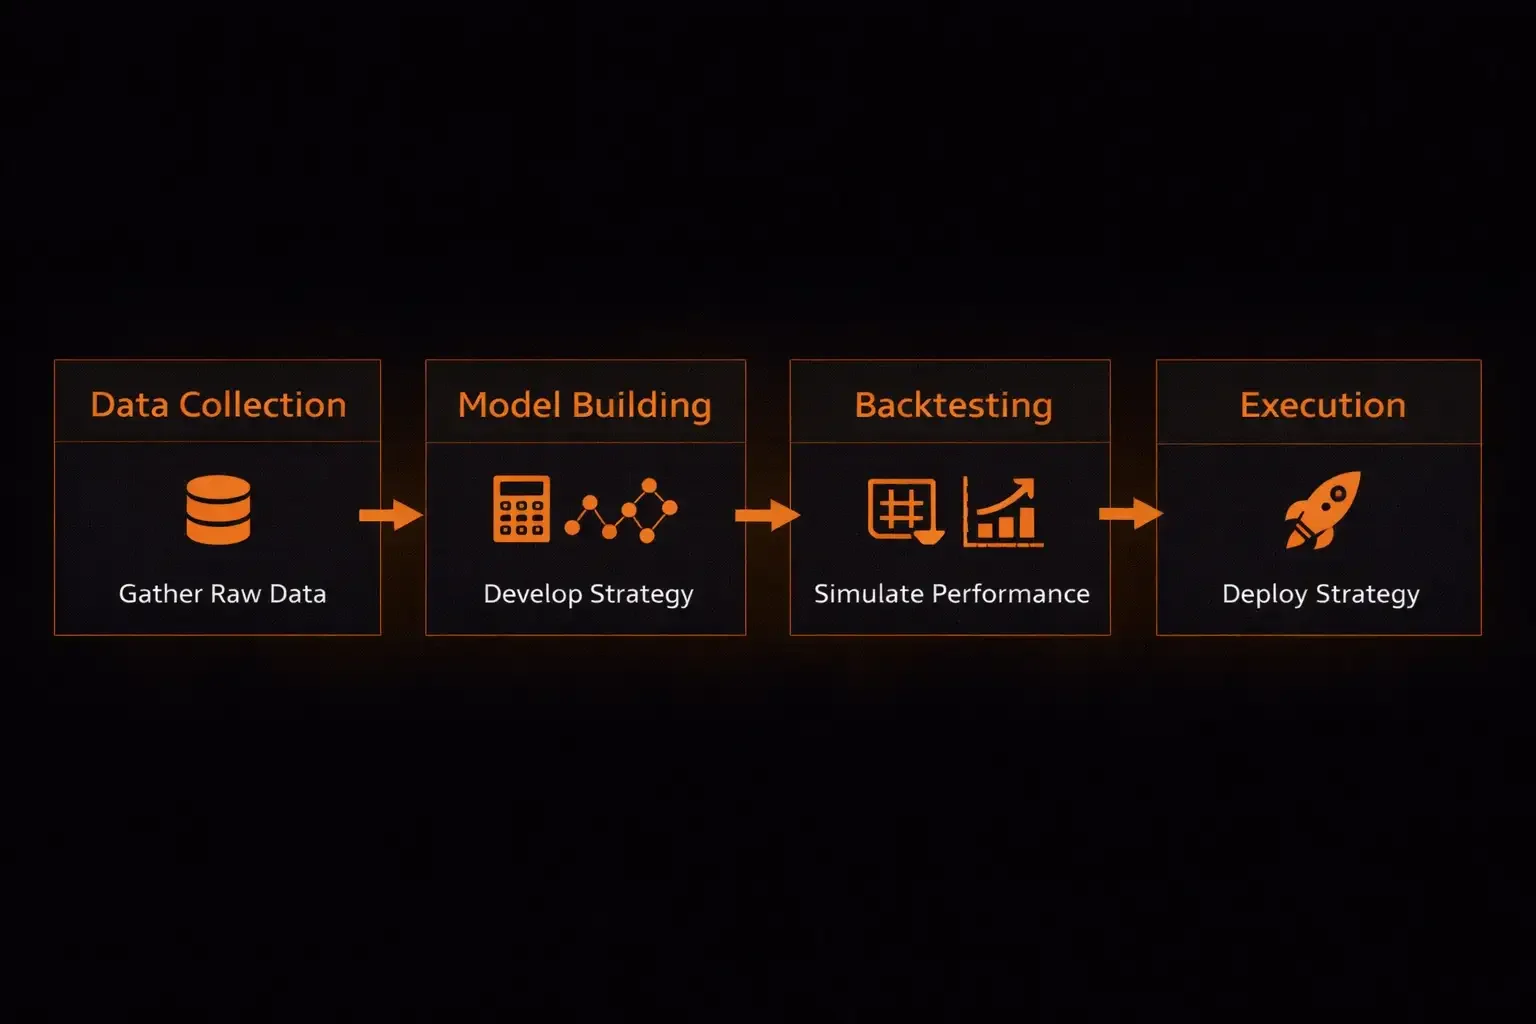
If quantitative trading still sounds abstract, that’s because it often gets described in abstract terms. The day-to-day workflow, though, is surprisingly structured. Think of it as a pipeline with four distinct stages, each feeding into the next.
Data Collection and Preparation
Everything starts with data. Quant traders collect, clean, and organize data from multiple sources: historical price and volume data, fundamental financial data (earnings, balance sheets), macroeconomic indicators, and sometimes alternative datasets.
The “preparation” part is where most of the unglamorous work happens. Raw data is messy. It has gaps, errors, and inconsistencies. A quant trader spends a significant chunk of time cleaning data, adjusting for stock splits, handling missing values, and aligning time zones. If your data is flawed, every model built on it inherits those flaws. Garbage in, garbage out isn’t just a cliché here. It’s the operating reality.
Model Building and Hypothesis Testing
With clean data in hand, you move to the creative and analytical heart of quant trading: building models. Good quant work starts with a hypothesis, a testable idea about how markets behave.
For example: “Stocks with consistently rising earnings revisions outperform their sector over the following quarter.” You’d then build a statistical model to test whether this relationship holds across different time periods, market conditions, and asset groups. You’re looking for relationships that are not just present in the data but robust enough to actually trade on.
This is where concepts like alpha (excess return above a benchmark) and the Sharpe ratio (risk-adjusted return) become central. A model that produces high returns but with wild volatility may not be worth trading. You’re optimizing for edges that are both statistically significant and practically viable.
Backtesting and Validation
Backtesting is where you stress-test your model against historical data to see how it would have performed. Consider it the quant trader’s dress rehearsal.
But here’s the catch: backtesting is easy to do poorly. The most common trap is overfitting, where your model is so perfectly tuned to past data that it crumbles in live markets. Imagine studying for an exam by memorizing every answer from last year’s test. If the questions shift even slightly, you’re lost. That’s overfitting in a nutshell.
Good backtesting involves out-of-sample testing (testing on data the model hasn’t seen), walk-forward analysis, and honest accounting for transaction costs, slippage, and market impact. If a model only works under perfect conditions, it doesn’t work.
Execution and Monitoring
Once a model passes validation, it’s deployed. This is typically where algorithmic trading enters the picture, automating the execution of signals the quant model generates. You need to monitor for:
- Model degradation (the edge weakening over time)
- Unusual market behavior that falls outside the model’s assumptions
- Technical failures in the execution pipeline
Even the best quant models aren’t “set and forget.” Markets evolve, relationships break down, and new data can shift the landscape. Continuous monitoring and periodic recalibration are part of the ongoing work.
Now that you understand the workflow, let’s dig into the specific strategies quant traders actually deploy.
Core Quantitative Trading Strategies
The world of quant strategies is broad, but most approaches fall into a handful of well-studied categories. Each exploits a different type of market behavior, and each carries its own risk profile. Here are five worth understanding.
Statistical Arbitrage
Statistical arbitrage (often shortened to “stat arb”) involves identifying pricing inefficiencies between related financial instruments and betting on those inefficiencies closing. If two stocks in the same sector historically move in tandem but temporarily diverge, a stat arb strategy would go long the underperformer and short the outperformer, expecting them to converge.
The “statistical” part means you’re betting on probabilities. Convergence might not happen, or it might take longer than your model expects. But when executed across hundreds or thousands of pairs, the law of large numbers tends to work in your favor.
Mean Reversion
Mean reversion is built on a simple but powerful observation: prices tend to return to their average over time. If a stock drops sharply below its historical average without a clear fundamental reason, a mean reversion model bets on a bounce back.
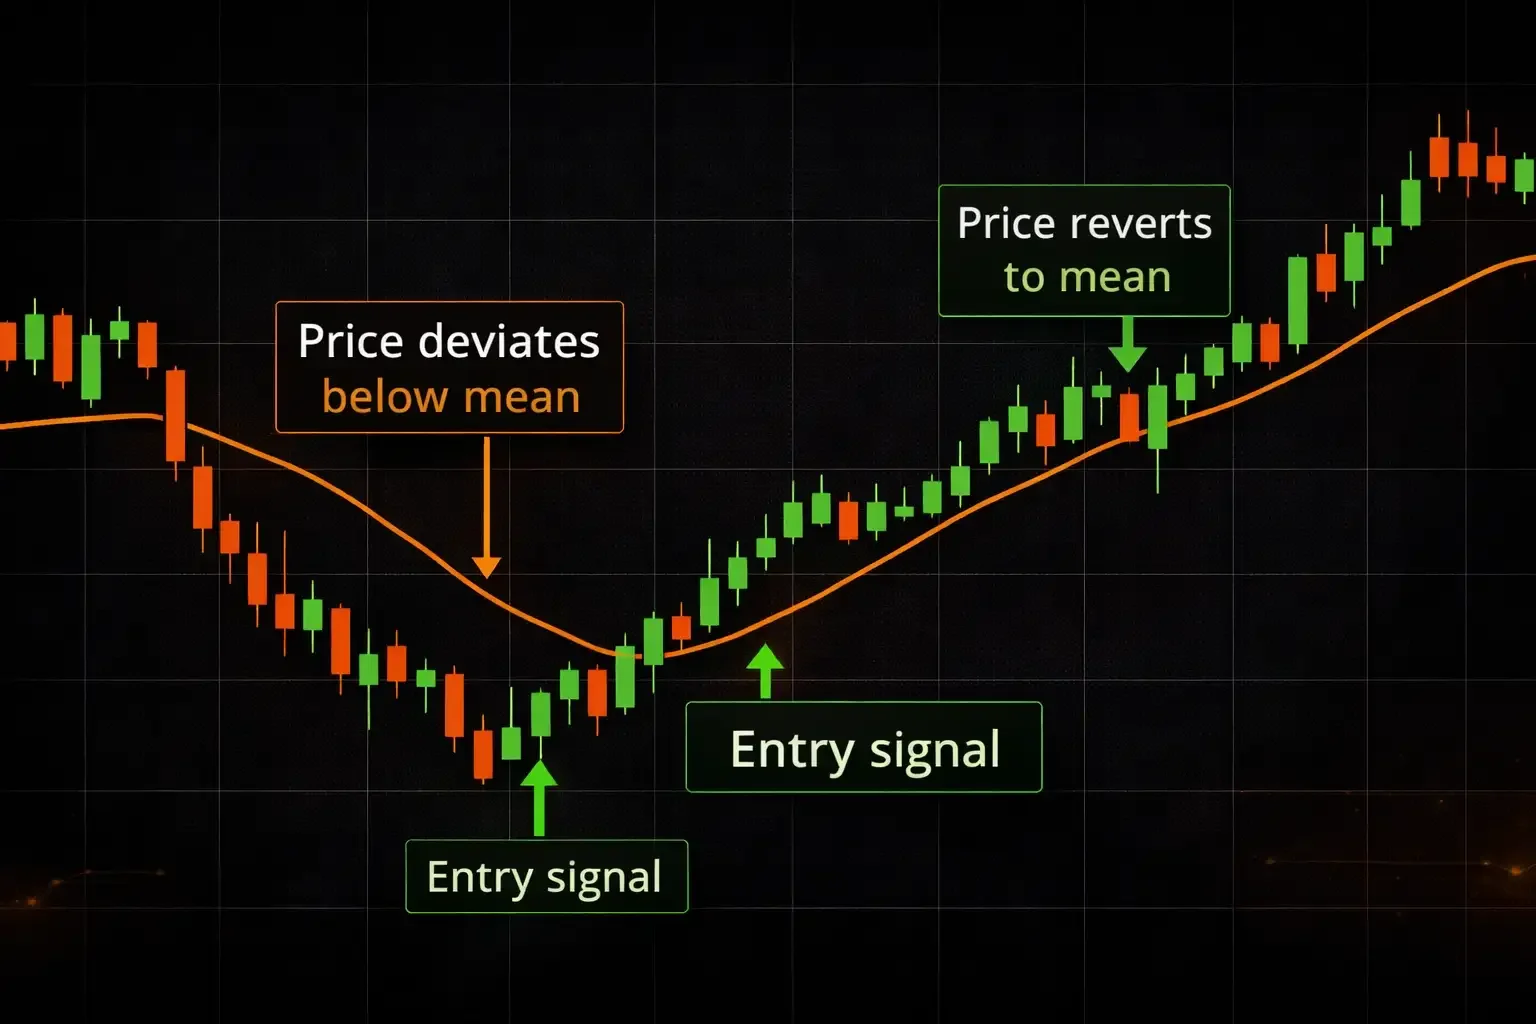
Picture a rubber band. You can stretch it, but it wants to snap back to its natural length. Mean reversion strategies treat price deviations the same way. The real challenge is distinguishing between a temporary deviation (your opportunity) and a permanent shift (a trap). That’s where statistical rigor earns its keep. You’re measuring how far price has moved from its mean relative to historical volatility and calculating the probability of reversion.
Momentum and Trend Following
While mean reversion bets on prices snapping back, momentum strategies bet on prices continuing in the direction they’re already moving. If a stock has been climbing for three months, momentum models suggest it’s more likely to keep climbing than to reverse, at least in the near term.
Academic research spanning decades and multiple asset classes has documented the momentum effect. The quant approach layers rigor on top by quantifying momentum through specific metrics (rate of change, relative strength, moving average slopes) and establishing defined rules for entry, exit, and position sizing.
Market Making
Market making involves continuously quoting both buy and sell prices for an asset, profiting from the spread between the two. Quant market makers use models to dynamically adjust their quotes based on inventory risk, volatility, and order flow.
This strategy is far more common at the institutional level, since it requires significant capital and very low latency. For retail traders, pure market making is largely out of reach. Still, understanding it helps you grasp how liquidity is created in the markets you trade.
Factor-Based Strategies
Factor investing identifies specific, measurable characteristics (factors) that historically drive returns. Common factors include:
- Value: cheap stocks outperforming expensive ones
- Size: small caps outperforming large caps
- Quality: companies with strong fundamentals outperforming weak ones
- Momentum: covered above as its own strategy
Quant traders build portfolios weighted toward stocks that score well on selected factors, rebalancing periodically as scores change. This approach sits at the intersection of quantitative analysis and fundamental investing, making it one of the more accessible quant strategies for retail traders willing to do the data work.
Having a strategy is only part of the equation, though. What tools and skills do you actually need to put quantitative methods into practice?
Tools and Skills Required for Quant Trading
Getting into quantitative trading demands a specific toolkit. Here’s what that looks like.
Programming and Data Science
Programming is non-negotiable. You need to be able to manipulate data, build models, and run backtests, and that means writing code.
- Python is the dominant language in retail quant trading and increasingly in institutional settings. Its ecosystem of libraries (pandas for data manipulation, NumPy for numerical computing, scikit-learn for machine learning, and specialized backtesting frameworks) makes it the practical choice for most people starting out.
- R remains popular in academic and statistical research circles, with strong capabilities for time-series analysis and statistical modeling.
Beyond coding, you need working knowledge of statistics and probability. You should be comfortable with concepts like regression, correlation, hypothesis testing, probability distributions, and the basics of time-series analysis.
Machine learning is increasingly part of the modern quant toolkit, used for pattern recognition, feature selection, and model optimization. It’s becoming harder to ignore as the field evolves.
Platforms and Data Sources
You’ll need reliable data and a platform to work with it. Historical price data is available from sources ranging from free (Yahoo Finance, some exchange APIs) to premium (Bloomberg, Refinitiv, Quandl). The quality gap between free and paid data is real, particularly for intraday data and alternative datasets.
For backtesting and strategy development, platforms range from open-source Python libraries to dedicated environments. What matters most is choosing tools that let you test rigorously without cutting corners on data quality or execution assumptions.
Knowing the tools is essential, but so is understanding what can go wrong. And in quant trading, quite a lot can go wrong.
Risks and Limitations of Quantitative Trading
Quantitative trading can give you a structured, disciplined edge. It also introduces risks that discretionary traders rarely face. If you’re going to pursue quant methods, you need clear-eyed awareness of these pitfalls.
Model Risk and Overfitting
This is the single biggest danger in quant trading. Overfitting happens when your model learns the noise in historical data rather than the actual signal. An overfitted model looks fantastic in backtests and falls apart the moment it touches live markets.
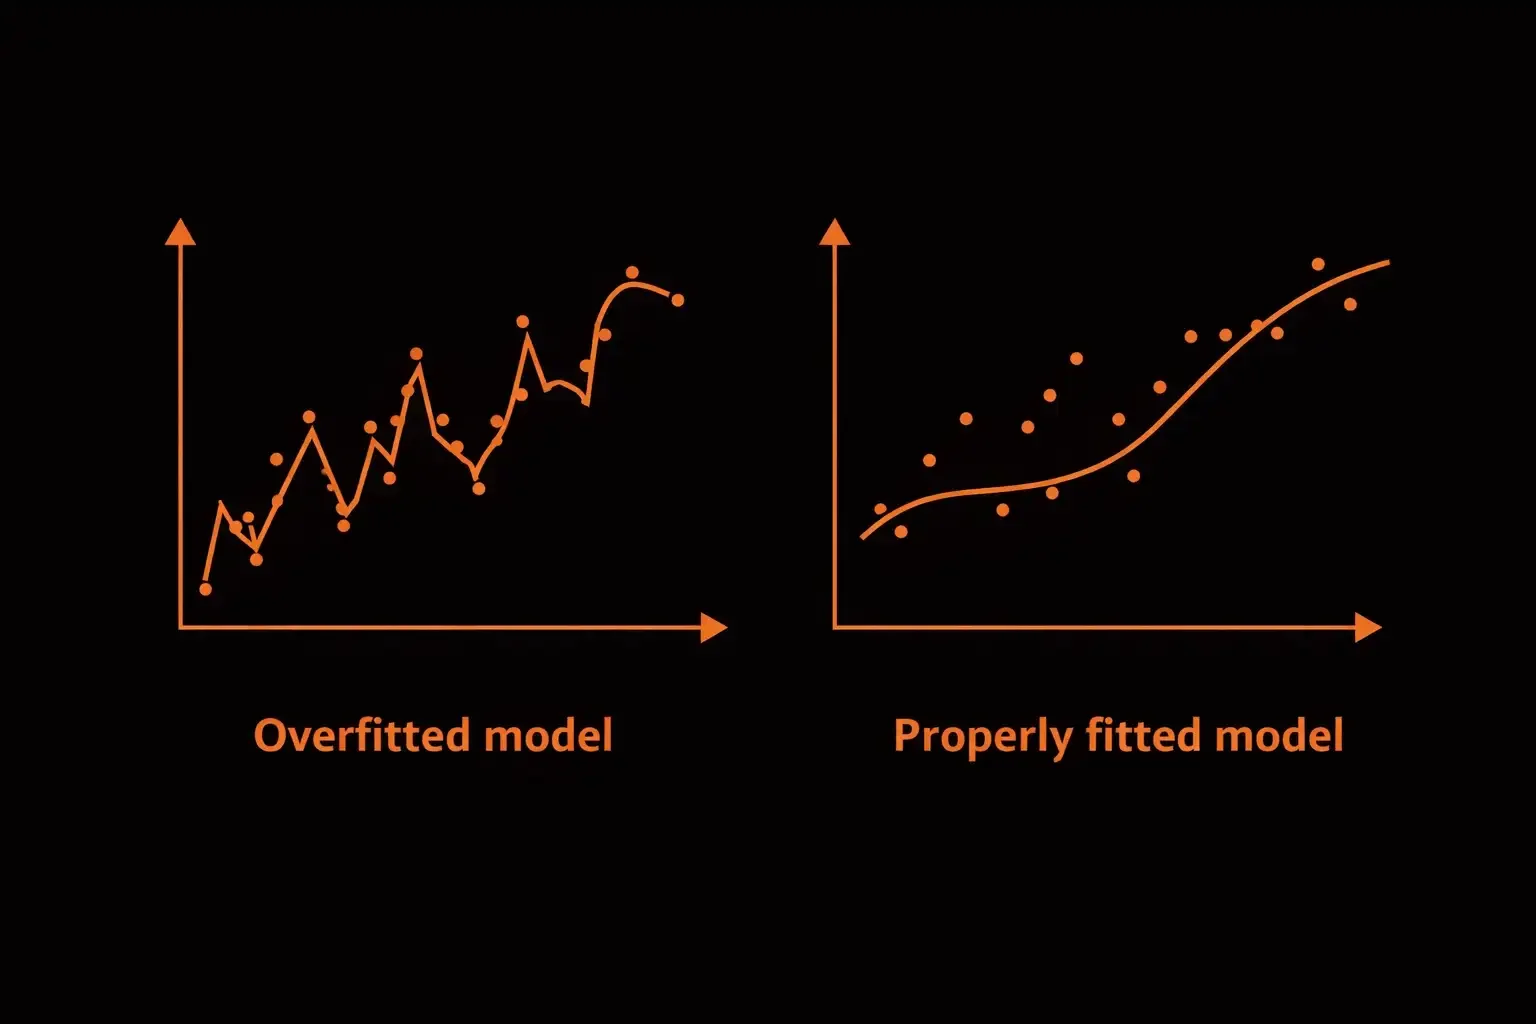
The temptation is real. When you can tweak parameters and add variables until your backtest equity curve looks flawless, it’s hard to stop. But every added parameter is a potential point of failure. The most effective quant traders tend to prioritize simple, robust models over complex, perfectly fitted ones.
Data Quality and Survivorship Bias
Your model is only as good as your data. Survivorship bias is a classic pitfall: if your historical dataset only includes stocks that still exist today, you’re ignoring every company that went bankrupt or was delisted. That paints an artificially rosy picture of how your strategy would have performed.
Other data issues to watch for include:
- Look-ahead bias: using information that wouldn’t have been available at the time of the trade
- Incorrect adjustments for splits and dividends
- Gaps in intraday data
Market Regime Changes
Markets don’t stay the same forever. A model built on data from a low-volatility bull market may break down entirely during a financial crisis or a period of rising interest rates. This is sometimes called “non-stationarity,” and it means that past relationships in market data are not guaranteed to persist.
Smart quant traders account for this by testing across multiple market regimes, building adaptive models, and maintaining strict risk controls that limit losses when a model stops performing as expected.
All of this might suggest quant trading is reserved for institutions with deep pockets and large teams. But is that actually the case?
Can Retail Traders Use Quantitative Methods?
The short answer is yes, with realistic expectations. You can absolutely apply quantitative thinking and methods to sharpen your trading.
Here’s what’s realistically within reach for a motivated retail trader:
- Factor screening and ranking. Using publicly available data to score and rank stocks by quantitative factors (value, momentum, quality) and building portfolios around those scores.
- Simple statistical models. Mean reversion and momentum strategies at the daily or weekly timeframe don’t require institutional infrastructure. A laptop, Python, and a reliable data source can get you started.
- Rigorous backtesting. Even if your strategy is relatively simple, applying proper backtesting discipline (out-of-sample testing, walk-forward analysis, accounting for costs) puts you ahead of the vast majority of retail traders.
- Risk quantification. Using statistical measures to size positions, set stop losses, and manage portfolio-level risk is a quant method that benefits any trading approach.
The barriers are real but not insurmountable. You’ll need to invest time learning programming and statistics. You’ll need patience, because building and testing models is slow, iterative work. And you’ll need discipline to trust your model’s signals even when your gut disagrees.
What retail quant trading won’t give you is an effortless algorithmic edge. Markets are competitive, and edges erode over time. But a quantitative approach gives you a framework for finding, testing, and managing edges systematically. Compared to trading on instinct alone, that’s a significant advantage.
Frequently Asked Questions


Comments