How to Find the Right Risk-Reward Ratio for Your Trades
Every trade comes down to a simple question: is the potential profit worth the potential loss?
The risk-reward ratio offers a structured way to answer this before entering any position. Calculating and applying this ratio helps you evaluate trades on their merits and maintain consistency in your decision-making.
This guide covers the mechanics of risk-reward ratio calculation, explains what different ratios actually mean when you’re trading, and provides a framework for selecting the right ratio based on your approach and market conditions.
This content is for educational purposes only and does not constitute financial advice.

What Is Risk-Reward Ratio
Risk-reward ratio (RRR) expresses the relationship between what you stand to lose on a trade versus what you stand to gain. It compares your potential downside to your potential upside in a single figure.
When you see a ratio expressed as 1:2, the first number represents your risk and the second represents your reward. A 1:2 ratio means you’re risking one unit to potentially gain two. Risk $100, and your target profit would be $200.
Traders use this ratio to filter opportunities and stay disciplined. Rather than chasing every setup that looks promising, RRR provides a consistent framework for deciding whether a trade offers enough upside to justify what you’re putting at risk.
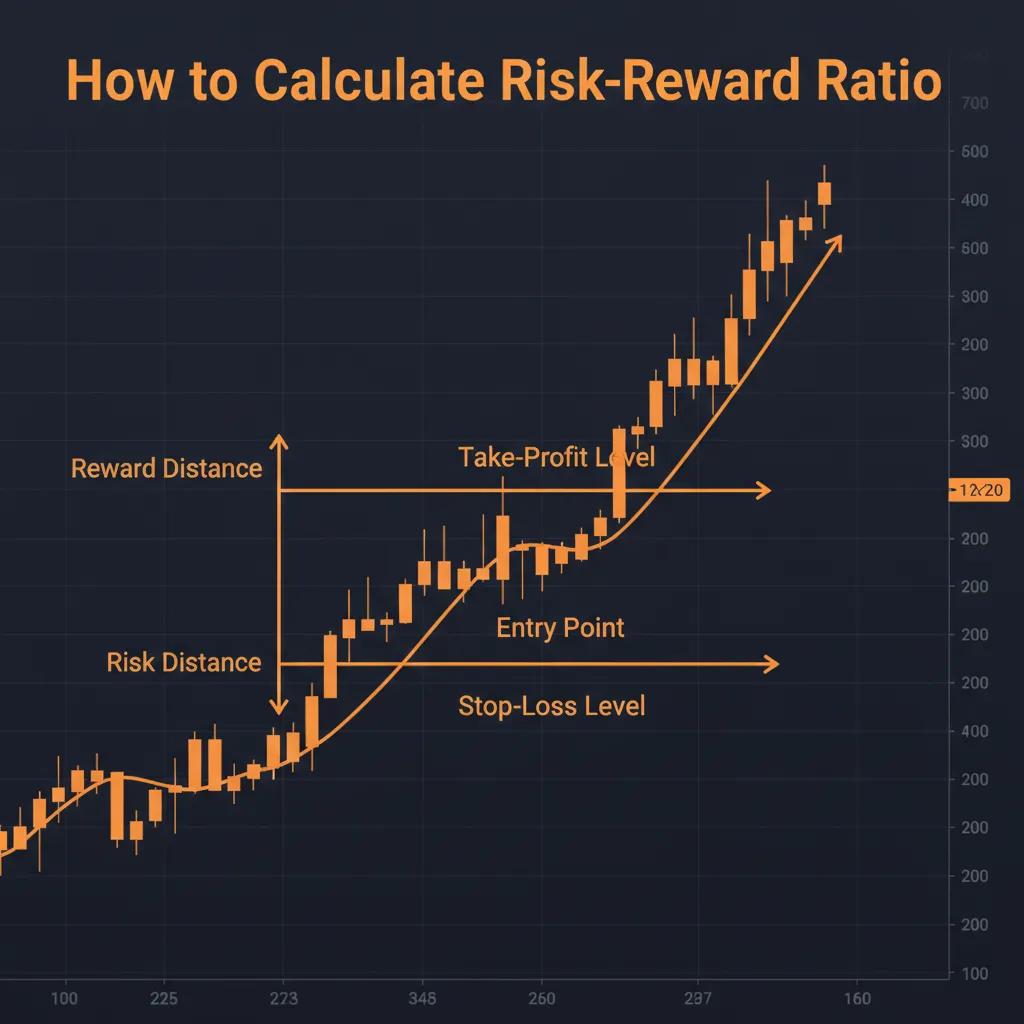
The Basic Formula
The basic formula for calculating risk-reward ratio is:
Risk-Reward Ratio = (Entry Price − Stop-Loss Price) / (Take-Profit Price − Entry Price)
For long positions:
- Risk = Entry Price − Stop-Loss Price
- Reward = Take-Profit Price − Entry Price
For short positions:
- Risk = Stop-Loss Price − Entry Price
- Reward = Entry Price − Take-Profit Price
The result is typically expressed as a ratio, such as 1:2 or 1:3, where 1 represents your risk unit and the second number shows how many multiples of that risk you expect to gain.
How to Calculate Risk-Reward Ratio
Step-by-Step Calculation
Consider this example for a long trade:
- Entry price: $50.00
- Stop-loss: $48.00
- Take-profit: $54.00
Step 1: Calculate your risk: Risk = Entry Price − Stop-Loss = $50.00 − $48.00 = $2.00
Step 2: Calculate your potential reward: Reward = Take-Profit − Entry Price = $54.00 − $50.00 = $4.00
Step 3: Express as a ratio: Risk:Reward = $2.00:$4.00 = 1:2
This trade has a 1:2 risk-reward ratio. For every dollar risked, the potential gain is two dollars.
Here’s a short trade example:
- Entry price: $100.00
- Stop-loss: $103.00
- Take-profit: $94.00
Risk = $103.00 − $100.00 = $3.00 Reward = $100.00 − $94.00 = $6.00 Risk:Reward = 1:2
Common Calculation Mistakes
Several errors frequently distort RRR calculations:
- Using account percentage instead of price levels. RRR should be calculated from actual price distances, not from what percentage of your account you’re risking. Position sizing is a separate consideration.
- Ignoring transaction costs. Spreads, commissions, and fees eat into your actual reward and can shift the real ratio, particularly on smaller trades.
- Setting unrealistic take-profit levels. Placing take-profit where the asset rarely reaches inflates your theoretical RRR without improving actual results.
- Measuring from the wrong price. Use your actual entry price, not the price when you spotted the setup. Slippage changes your real ratio.
- Forgetting to account for direction. Long and short trades reverse which price is subtracted from which. Mixing this up produces incorrect ratios.
What Is a Good Risk-Reward Ratio
What counts as a “good” ratio depends heavily on context. That said, certain ratios come up frequently in trading discussions because of their mathematical properties.
The 1:2 Ratio Explained
A 1:2 risk-reward ratio means your potential profit is twice your potential loss. This ratio is popular because it allows for profitability even with a modest win rate.
With a 1:2 ratio, you need to win roughly 33.4% of your trades to break even (before costs). Win 40% of trades at 1:2, and you’re profitable over time.
Example with 10 trades at 1:2 (risking $100 per trade):
- 4 wins × $200 = $800 gained
- 6 losses × $100 = $600 lost
- Net result: +$200
The 1:2 ratio strikes a balance between achievable targets and favorable mathematics. Many traders treat it as a reasonable minimum threshold.
The 1:3 Ratio Explained
A 1:3 ratio means potential profit is three times the potential loss. The mathematics become even more favorable, but achieving this typically requires either wider price targets or tighter stop-losses.
With a 1:3 ratio, breakeven occurs at roughly 25% win rate. A trader winning just 30% of trades at 1:3 remains profitable.
Example with 10 trades at 1:3 (risking $100 per trade):
- 3 wins × $300 = $900 gained
- 7 losses × $100 = $700 lost
- Net result: +$200
Higher reward targets are harder to hit. Price may reverse before reaching a 3x target more often than a 2x target, which can drag down your win rate.
Why There Is No Universal “Best” Ratio
No single ratio works optimally for all traders, strategies, or market conditions. The right ratio depends on several interconnected factors:
- Win rate and RRR pull in opposite directions. Wider targets (higher RRR) typically reduce win rate. Tighter targets (lower RRR) typically increase it. The combination matters more than either factor alone.
- Market structure varies. Some markets and timeframes offer cleaner moves to larger targets. Others chop around, making smaller targets more realistic.
- Strategy type affects achievable ratios. Mean reversion strategies often work with lower RRR and higher win rates. Trend-following approaches may accept lower win rates for higher RRR.
- Individual execution differs. Two traders using identical ratios will get different results based on entry timing, trade selection, and how they manage positions.
Searching for a universally “best” ratio misses the point. The goal is finding a ratio that fits your trading style, current market conditions, and realistic expectations about your win rate.
How to Choose the Right Ratio for Your Strategy
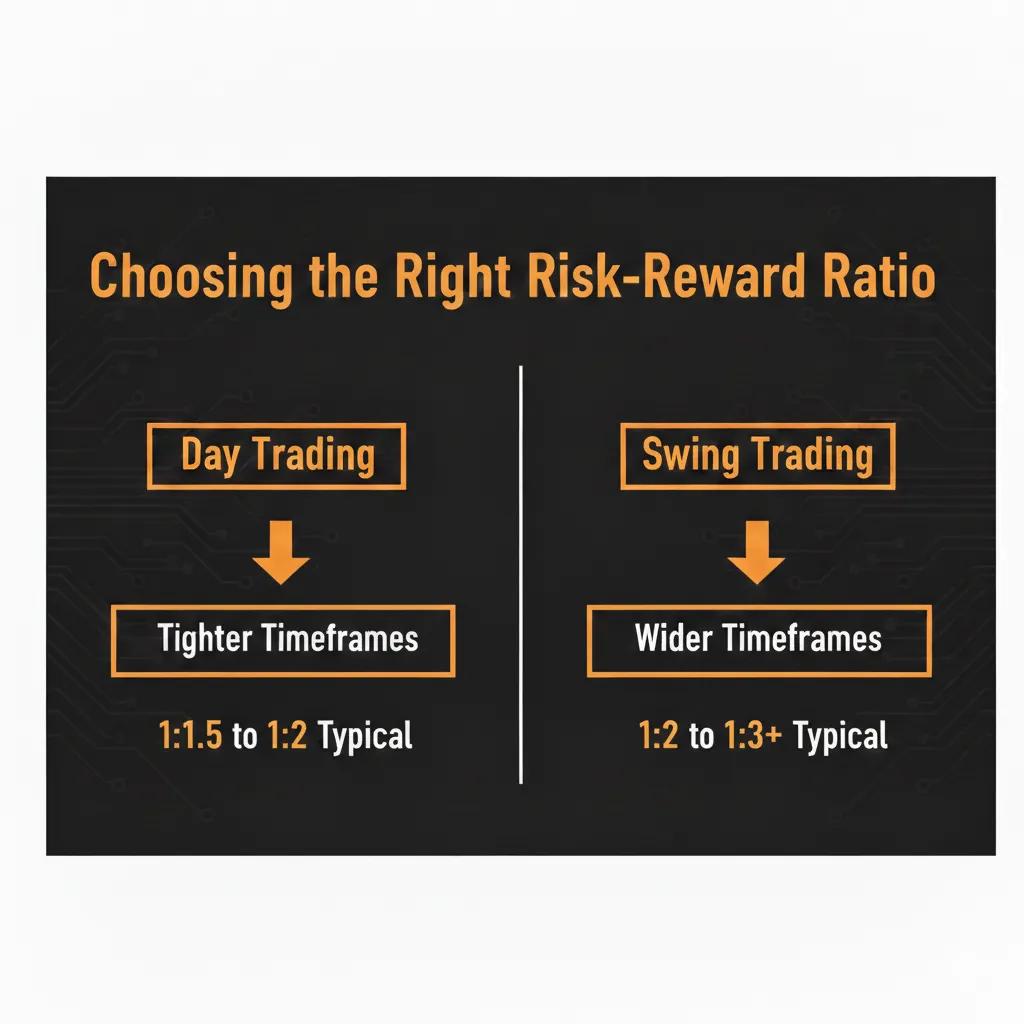
Day Trading Considerations
Day traders work with compressed timeframes and smaller price movements, which creates specific RRR considerations:
- Tighter stops are common. Smaller timeframes leave less room for price to move against you before the setup is invalidated.
- Transaction costs matter more. With smaller gains per trade, spreads and commissions consume a larger percentage of profit. This effectively reduces your real RRR.
- More trading opportunities exist. Day traders can take more trades, potentially offsetting lower per-trade ratios with volume.
- Ratios of 1:1.5 to 1:2 are frequently used. While lower than swing trading norms, these ratios can work when combined with higher win rates and precise execution.
Day traders often prioritize consistency and high-probability setups over maximizing RRR on any single trade.
Swing Trading Considerations
Swing traders hold positions for days to weeks, which changes the dynamics:
- Wider stops accommodate normal volatility. Holding through overnight sessions and multiple trading days requires stops that won’t trigger on routine price fluctuations.
- Larger price moves are possible. Extended holding periods let trades capture more substantial moves, supporting higher RRR targets.
- Fewer trades mean each one carries more weight. With reduced trading frequency, careful trade selection and favorable RRR become more important.
- Ratios of 1:2 to 1:3 or higher are common. Swing traders often seek setups where the potential move justifies the wider stop and longer holding period.
For swing trading, accepting a lower win rate in exchange for higher RRR per trade often makes sense, both mathematically and practically.
Win Rate and RRR Relationship
Win rate and risk-reward ratio exist in tension. Understanding this relationship helps you set realistic expectations.
The table shows minimum win rates needed to break even at each ratio (excluding transaction costs). In practice, you need to exceed these thresholds to turn a profit.
Key observations:
- Higher RRR lowers the required win rate but typically makes that win rate harder to achieve.
- A high win rate with poor RRR can still lose money. Winning 70% of trades means nothing if your losses are three times your wins.
- A low win rate with excellent RRR can be highly profitable. Winning 35% of trades at 1:3 generates consistent positive returns.
Rather than optimizing one factor in isolation, focus on the combination. A 45% win rate with 1:2 RRR produces similar results to a 30% win rate with 1:3 RRR.
Applying Risk-Reward Ratio in Practice
Setting Stop-Loss and Take-Profit Based on RRR
When applying RRR to real trades, avoid forcing arbitrary ratios onto market structure. A more reliable approach:
- Identify a logical stop-loss level first. Base this on technical factors: support/resistance, recent swing points, or volatility. The stop should sit at a level where your trade thesis is clearly wrong if price reaches it.
- Determine a realistic take-profit level. Look for areas where price may encounter resistance (for longs) or support (for shorts). Consider previous price behavior and current conditions.
- Calculate the resulting RRR. With both levels defined, work out the ratio.
- Evaluate whether the trade meets your criteria. If the RRR falls below your minimum threshold, the trade may not be worth taking, regardless of how good the setup looks.
This approach keeps RRR as a filter rather than a forcing function. You’re assessing whether the natural levels produce an acceptable ratio.
Adjusting RRR for Market Conditions
Market conditions shift, and rigid RRR rules may need flexibility:
During high volatility:
- Consider wider stops to avoid getting stopped out by noise
- Larger targets become achievable as price swings expand
- The same RRR may require position size adjustments (see position sizing for related concepts)
During low volatility or ranging markets:
- Tighter targets may be more realistic
- Breakout trades tend to fail more often, affecting win rates
- Lower RRR with higher-probability setups might make more sense
During trending conditions:
- Trend-following trades may support higher RRR
- Stops behind swing points give trades room while maintaining favorable ratios
- Trailing stops can extend reward beyond initial targets
The goal is understanding how your target ratio interacts with current market behavior, and adjusting your trade selection accordingly.
Frequently Asked Questions
What is the minimum risk-reward ratio I should use?
Many traders use 1:2 as a minimum threshold, meaning they won't take trades offering less than twice the risk in potential reward. But this varies by strategy. Some high-probability approaches work fine at 1:1.5, while trend-following systems may require 1:3 or higher. The minimum that makes sense depends on your realistic win rate.
Should I always use the same risk-reward ratio?
Not necessarily. While consistency has value, rigid adherence to one ratio regardless of context can mean passing on good opportunities or taking suboptimal ones. Many traders set a minimum acceptable ratio but allow variation based on setup quality and market conditions.
Does a higher risk-reward ratio mean a better trade?
Not automatically. A 1:5 ratio sounds attractive, but if the target is unrealistic, you may rarely hit it. A more modest 1:2 ratio with a higher probability of reaching target often produces better actual results. Quality depends on the combination of ratio and achievable win rate, not ratio alone.
How does risk-reward ratio relate to position sizing?
RRR tells you the relationship between potential loss and gain on a trade. Position sizing determines how much capital you allocate based on your risk tolerance. They work together: RRR helps you evaluate trade quality, while position sizing manages how much you stake on trades you decide to take.
Can I be profitable with a 1:1 risk-reward ratio?
Yes, if your win rate exceeds 50% after accounting for transaction costs. Some scalping and mean reversion strategies operate profitably at 1:1 or lower by achieving high win rates. The math still needs to work: you need to win more often than you lose when your wins and losses are equal size.
Should I adjust my stop-loss to get a better ratio?
Only if the adjusted level still makes technical sense. Moving a stop closer just to improve the ratio on paper puts you at risk of getting stopped out by normal price movement. If a logical stop produces an unfavorable ratio, the better choice is usually to skip the trade rather than force a tighter stop.
About the authors


Related articles

Cognitive Bias in Trading: How Mental Blind Spots Hurt Your Results
Learn how cognitive biases like confirmation bias and loss aversion affect your trading decisions. Discover practical techniques to recognize and overcome them.

Common Trading Mistakes and How to Avoid Them
Learn the most common trading mistakes that cost beginners money. Discover how to identify and avoid these errors to protect your capital and improve results.
Hedging Strategies in Trading: How to Protect Positions
Learn how hedging strategies help traders manage risk. Explore options, pairs trading, and diversification techniques with practical guidance.
0 comments