VIX Fear Index: What It Is, How It Works, and What It Tells Traders
Markets don’t text you before they fall apart. One week your portfolio is grinding higher, and the next, headlines are screaming about a sell-off you never saw coming. That gut-punch is precisely what the VIX Fear Index was designed to measure.
The VIX distills the collective anxiety (or composure) of the options market into a single number. If you’ve ever wondered what professional traders actually watch when they’re sizing up how nervous the market is, this is it. Once you learn to read it, you’ll have a sharper lens on market sentiment indicators than most retail investors ever develop.
This guide breaks down what the VIX measures, the mechanics behind the number, how to interpret its readings, and where it fits (and doesn’t fit) into your trading toolkit.
This article is for educational purposes only and does not constitute financial advice.
What Is the VIX Fear Index?
Definition and Origin
The VIX, formally the Cboe Volatility Index, is a real-time index reflecting the market’s expectation of volatility over the next 30 days. Published and maintained by Cboe (the Chicago Board Options Exchange), it’s derived entirely from the prices of S&P 500 index options.
The key distinction is that the VIX doesn’t tell you what the market did. It tells you what the market expects to happen. It’s forward-looking by design, capturing what options traders are collectively pricing in about near-term uncertainty.
The index debuted in 1993 and underwent a significant methodology overhaul in 2003 to broaden the range of options feeding into its calculation. Since then, it has become one of the most closely watched indicators in global finance.
Why Is the VIX Called the Fear Gauge?
The nickname stuck because the relationship is remarkably consistent: when investors get scared, the VIX climbs. As uncertainty mounts, demand for protective options (especially puts) surges. That demand pushes options prices higher, and since the VIX is built on those prices, the index spikes.
Think of it as a thermometer for market anxiety. A normal reading means the patient is stable. A sudden jump means something is wrong. Or, at the very least, the market strongly suspects something is about to go wrong.
The reverse holds too. When markets are calm and trending upward, traders feel less urgency to buy protection. Options prices drift lower, and the VIX settles into subdued territory.
So how do analysts actually arrive at this number? The calculation is more elegant than you might expect.
How the VIX Is Calculated
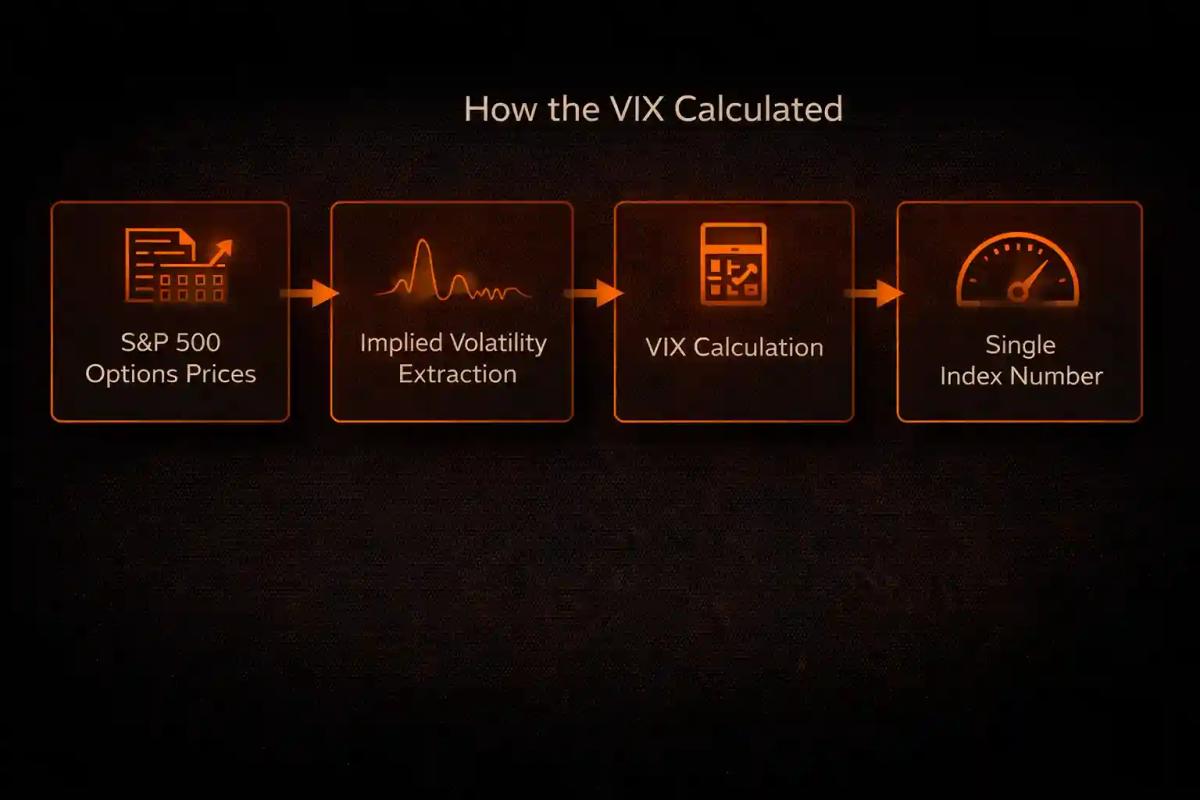
The Role of S&P 500 Options
The VIX draws from a wide strip of S&P 500 index options (both calls and puts) spanning multiple strike prices. The methodology uses near-term options (expiring within roughly 23 to 37 days) to capture that 30-day forward window.
The core logic is that if traders expect big price swings ahead, they’ll pay more for options. If they expect smooth sailing, they’ll pay less. The VIX formula aggregates those prices and extracts a weighted measure of expected volatility, expressed as an annualized percentage.
So when the VIX reads 20, the market is pricing in an expected annualized move of roughly 20% in the S&P 500. To translate that into monthly terms, divide by the square root of 12, yielding an expected monthly move of about 5.8%. It tells you the scale of movement the market is bracing for.
Implied Volatility vs. Historical Volatility
This is where the concept tends to click. There are two types of volatility you’ll encounter, and mixing them up is one of the most common stumbling blocks.
Historical volatility looks backward. It measures how much an asset’s price actually moved over a past period. It’s a fact,a record of what already happened.
Implied volatility looks forward. It’s baked into the price of an options contract and reflects what traders expect to happen. It’s closer to an opinion, a consensus wager on future uncertainty.
The VIX is built entirely on implied volatility. It doesn’t care what the S&P 500 did last month. It cares about what options traders think it will do next month. That’s what makes it a sentiment tool rather than a backward-looking statistic.
Understanding the calculation matters, but knowing how to interpret readings is where the VIX becomes practical.
How to Read the VIX
VIX Levels and What They Indicate
Not all VIX readings carry the same weight. Over time, market participants have developed general interpretation zones that help frame what a given number means.
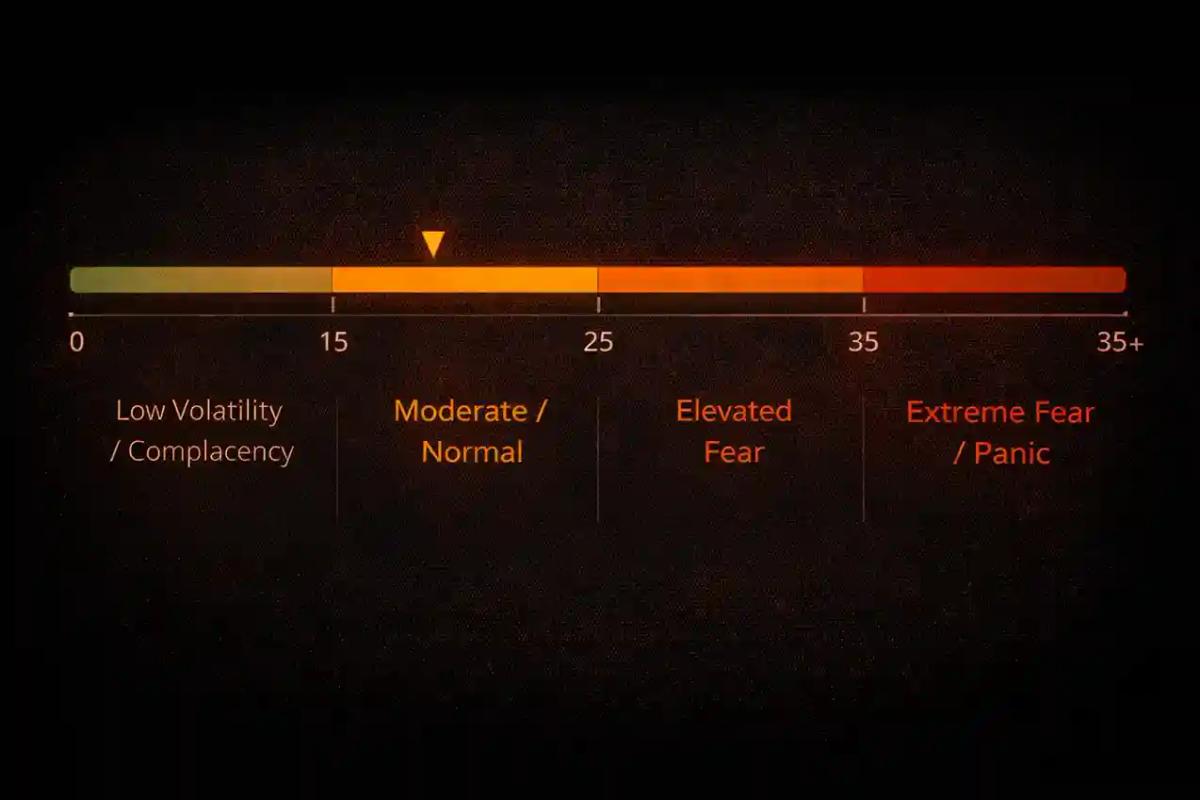
A few nuances worth sitting with: a VIX of 18 during a steady bull run tells a very different story than a VIX of 18 that just dropped from 35. Context and direction matter as much as the raw number. A declining VIX suggests fear is bleeding out of the market. A rising VIX, even from a low base, signals that nervousness is building.
You’ve probably seen headlines about VIX spikes without knowing exactly what triggered them. The historical record puts those numbers into sharp relief.
Historical VIX Spikes and Market Events
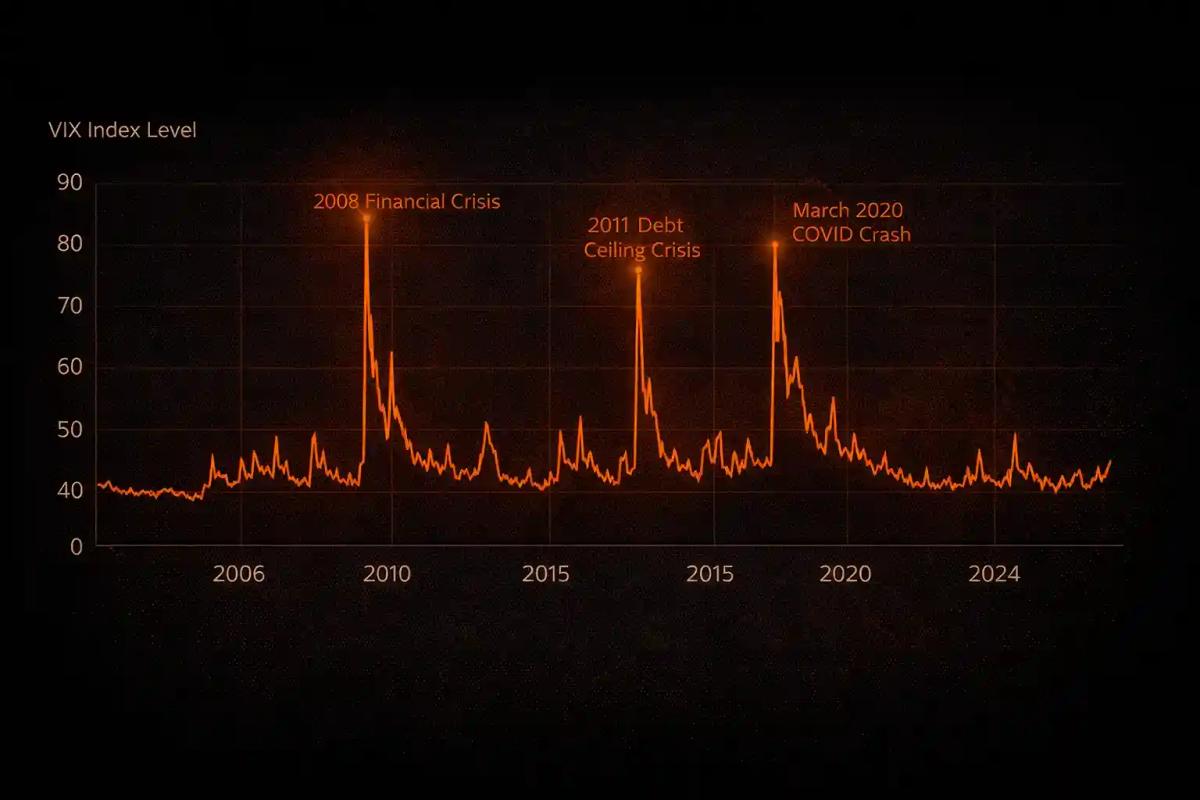
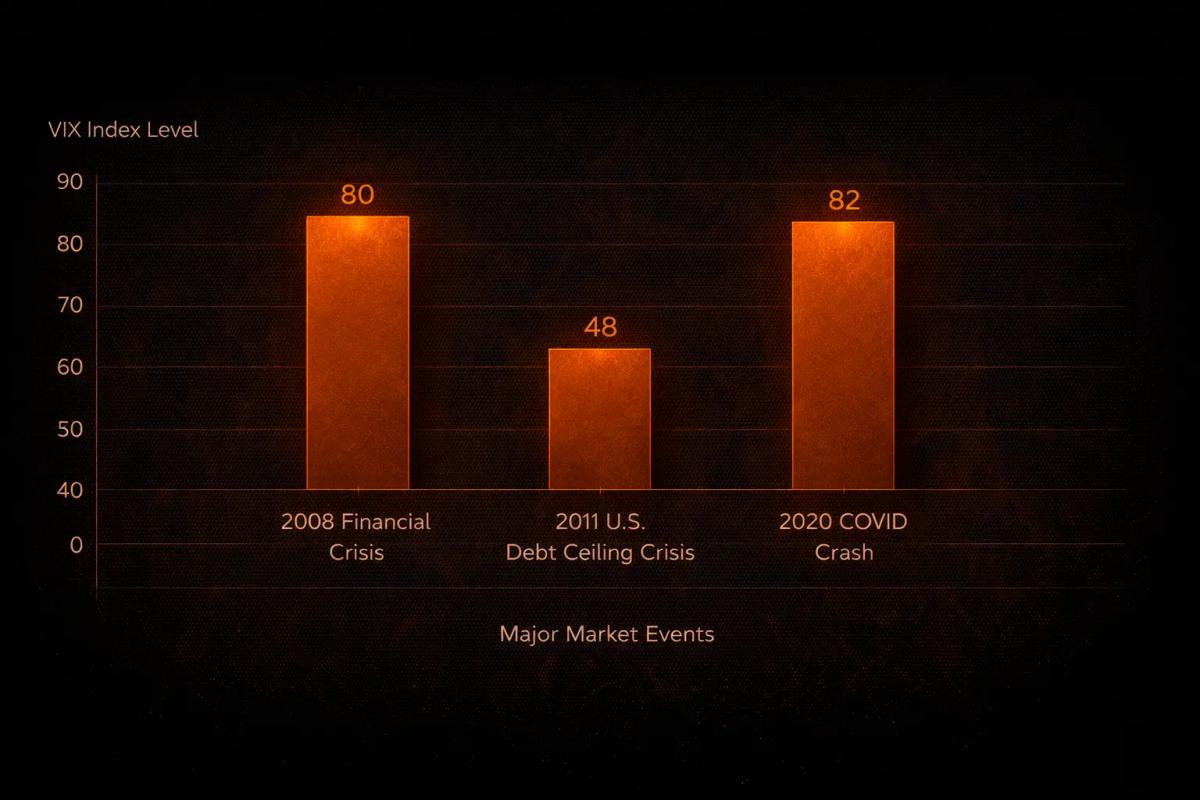
The VIX has punctuated every major market crisis of the past two decades with dramatic spikes. Revisiting those moments helps you calibrate what “extreme” actually looks like in practice.
2008 Financial Crisis: At the peak of the global financial meltdown in October and November 2008, the VIX surged to intraday levels near 80. This reflected a market where institutions genuinely didn’t know whether major banks would survive the week. Options prices went parabolic as demand for downside protection overwhelmed everything else.
2011 U.S. Debt Ceiling Crisis: The VIX jumped to around 48 in August 2011 when S&P downgraded the U.S. credit rating for the first time in history. The spike was sharp but shorter-lived than 2008, reflecting a political crisis rather than a structural financial one.
March 2020 COVID Crash: The VIX hit approximately 82 in mid-March 2020, rivaling the 2008 peak as global lockdowns triggered the fastest bear market in history. The sheer speed of the sell-off, combined with total uncertainty about the pandemic’s economic fallout, created a fear environment that was historically rare.
Each episode followed the same arc: a sudden threat that nobody could confidently size, an explosion in demand for protective options, and the VIX rocketing upward as a result.
Knowing what the VIX reads is only half the picture, though. How do traders actually use it?
How Traders Use the VIX
Sentiment Indicator for Market Timing
For many traders, the VIX serves first and foremost as a sentiment gauge. It delivers a quick, quantitative read on how nervous or confident the broader market is, without requiring you to sift through dozens of individual data points.
When the VIX is elevated, it often signals that institutional money is hedging aggressively, which can coincide with short-term market bottoms. On the flip side, extremely low VIX readings sometimes precede volatility expansions, since complacency can leave the market exposed to surprise shocks.
That said, treating the VIX as a simple “buy when high, sell when low” signal is a dangerous oversimplification. It works best as one input among several, layered with other forms of analysis rather than relied on in isolation.
Hedging and Portfolio Protection
If you hold a portfolio of U.S. equities, the VIX gives you a rough gauge of how expensive or cheap portfolio protection currently is. When the VIX is low, options are relatively inexpensive, meaning the cost of hedging is lower. When the VIX is elevated, protection costs more, because the market is already pricing in turbulence.
Some investors use VIX levels to time when they add or adjust hedges. The logic is straightforward: buying insurance before the storm is cheaper than buying it while the rain is already falling. Tracking the VIX helps you gauge where you sit on that spectrum.
VIX-Based Trading Instruments
A range of financial products offer exposure to VIX movements, including VIX futures contracts and various exchange-traded products (ETFs and ETNs) linked to VIX futures.
These instruments exist and are actively traded, but they come with a serious caveat: they are complex, they don’t perfectly track the spot VIX, and they carry risks that make them unsuitable for many investors. If you’re encountering these instruments for the first time, thorough independent research is non-negotiable before considering any exposure.
VIX derivatives are complex instruments that may not be appropriate for all investors. They can carry significant risks including the potential for substantial losses.
The VIX is a powerful lens, but every lens has its distortions. Where does it fall short?
Limitations of the VIX
What the VIX Does Not Measure
The VIX tells you about the expected magnitude of movement. It does not tell you direction. A VIX reading of 30 means the market expects significant movement, but it says nothing about whether that movement will be up or down. This is one of the most frequently overlooked points, and it trips up even experienced traders.
The VIX is also specific to the S&P 500. It doesn’t directly reflect volatility expectations for other asset classes, individual stocks, commodities, or international markets. Other volatility indices exist for different markets: the VXN tracks expected volatility in the Nasdaq 100, for instance, but the VIX itself is scoped to large-cap U.S. equities.
There’s a time horizon limitation too. The VIX captures a 30-day window. It won’t tell you much about what the market expects three or six months out without examining the VIX futures term structure, which introduces its own layer of complexity.
Common Misinterpretations
A few traps catch people over and over:
- “High VIX means the market will crash.” Not necessarily. Elevated VIX readings reflect heightened expectation of large moves, but the market can remain volatile without declining further, or it can rebound sharply from high-VIX environments.
- “Low VIX means it’s safe to be fully invested.” Low VIX means the market is currently calm. It doesn’t promise that calm will last. Some of the sharpest sell-offs in history have erupted from low-VIX environments.
- “The VIX predicts what will happen.” The VIX reflects a consensus expectation, not a prophecy. Implied volatility frequently overstates or understates what actually unfolds. It’s a measure of sentiment, not a crystal ball.
Your best approach is to treat the VIX as one piece of a broader analytical puzzle: a valuable one, but never the whole picture.
Frequently Asked Questions
What does a VIX reading of 20 mean?
A VIX of 20 indicates the market expects the S&P 500 to move approximately 20% on an annualized basis over the next 30 days. In practical terms, that translates to an expected monthly move of roughly 5.8%. This falls within the moderate range and is generally considered normal market conditions.
Can you buy or sell the VIX directly?
No. The VIX itself is an index, a calculated number, and you can't trade it directly. However, VIX futures and exchange-traded products linked to VIX futures do exist. These instruments track VIX futures rather than the spot VIX, and their behavior can diverge significantly from the index itself.
Is a high VIX always bad for stocks?
Not always. While a high VIX reflects fear and often accompanies market declines, extremely elevated VIX readings have historically preceded strong market rebounds. Fear tends to peak near market bottoms. That said, this pattern is far from guaranteed and shouldn't be treated as a timing signal on its own.
How often is the VIX updated?
The VIX is calculated in real time during U.S. market hours and updates continuously throughout the trading day.
What is the difference between the VIX and realized volatility?
The VIX measures implied (expected) volatility: what the market thinks will happen. Realized volatility measures what actually happened over a given period. The two frequently diverge, and comparing them can reveal whether the market was more or less fearful than conditions ultimately warranted. This content is for educational and informational purposes only. It does not constitute financial, investment, or trading advice. Trading volatility products involves significant risk and may not be suitable for all investors. Always conduct your own research and consult a qualified financial professional before making investment decisions.
About the authors


Related articles
Cognitive Bias in Trading: How Mental Blind Spots Hurt Your Results
Learn how cognitive biases like confirmation bias and loss aversion affect your trading decisions. Discover practical techniques to recognize and overcome them.
Common Trading Mistakes and How to Avoid Them
Learn the most common trading mistakes that cost beginners money. Discover how to identify and avoid these errors to protect your capital and improve results.
Hedging Strategies in Trading: How to Protect Positions
Learn how hedging strategies help traders manage risk. Explore options, pairs trading, and diversification techniques with practical guidance.
0 comments